In the world of financial markets, where trends and reversals can make or break trading strategies, the use of technical analysis tools becomes indispensable. Among these tools, engulfing candlestick patterns have gained significant popularity due to their ability to identify market reversals. Engulfing candlesticks, like a tidal wave engulfing a small boat, provide traders with crucial insights into the changing dynamics of asset prices.
Bullish engulfing patterns, characterized by a small red candle followed by a larger green candle, signify a shift from a downtrend to an uptrend. This pattern suggests that buyers have seized control of the market, prompting traders to consider buying or closing short positions. Conversely, bearish engulfing patterns indicate a reversal from an uptrend to a downtrend, with bears taking over the market. This insight can guide traders to enter short positions or close long positions.
However, it is important to note that engulfing candlesticks are lagging indicators, and their effectiveness is enhanced when combined with volume indicators. By analyzing the strength of the trend alongside these patterns, traders can make more informed decisions. In this article, we will explore the intricacies of trading using bullish and bearish engulfing candlesticks, providing valuable strategies for market participants.
Key Takeaways
- Bullish and bearish engulfing candlestick patterns are used to identify market reversals in forex trading.
- A bullish engulfing pattern indicates a potential uptrend, while a bearish engulfing pattern suggests a potential downtrend.
- Engulfing candles are lagging indicators and require the previous two candlesticks’ data before a signal is given.
- These patterns can be used to enter or exit positions, with a bullish engulfing pattern signaling a buy or close a short position, and a bearish engulfing pattern signaling a short position or close a long position.
What are Engulfing Candlesticks?
Engulfing candlesticks consist of two bars on a price chart and are used in technical analysis to identify reversals in the price of an asset, particularly in forex trading. These candlestick patterns are considered important tools for traders as they provide valuable information about market sentiment and potential trend changes. The benefits of using engulfing candlesticks in forex trading include their ability to signal potential trend reversals, allowing traders to enter or exit positions at favorable prices.

To identify and interpret engulfing candlestick patterns, traders look for specific criteria, such as a small candle followed by a larger one that completely engulfs the previous candle’s body. A bullish engulfing pattern appears in a downtrend and indicates a potential bullish reversal, while a bearish engulfing pattern suggests a potential bearish reversal in an uptrend. Traders use these patterns in conjunction with other technical indicators and analysis tools to make informed trading decisions.
Bullish Engulfing Pattern
The appearance of a larger green candle following a short red candle in a specific pattern can indicate a potential reversal in the market trend. This pattern is known as a bullish engulfing pattern and is often used by traders to identify trend reversals. When a bullish engulfing pattern forms, it suggests that buyers have taken control of the market and could push prices higher.
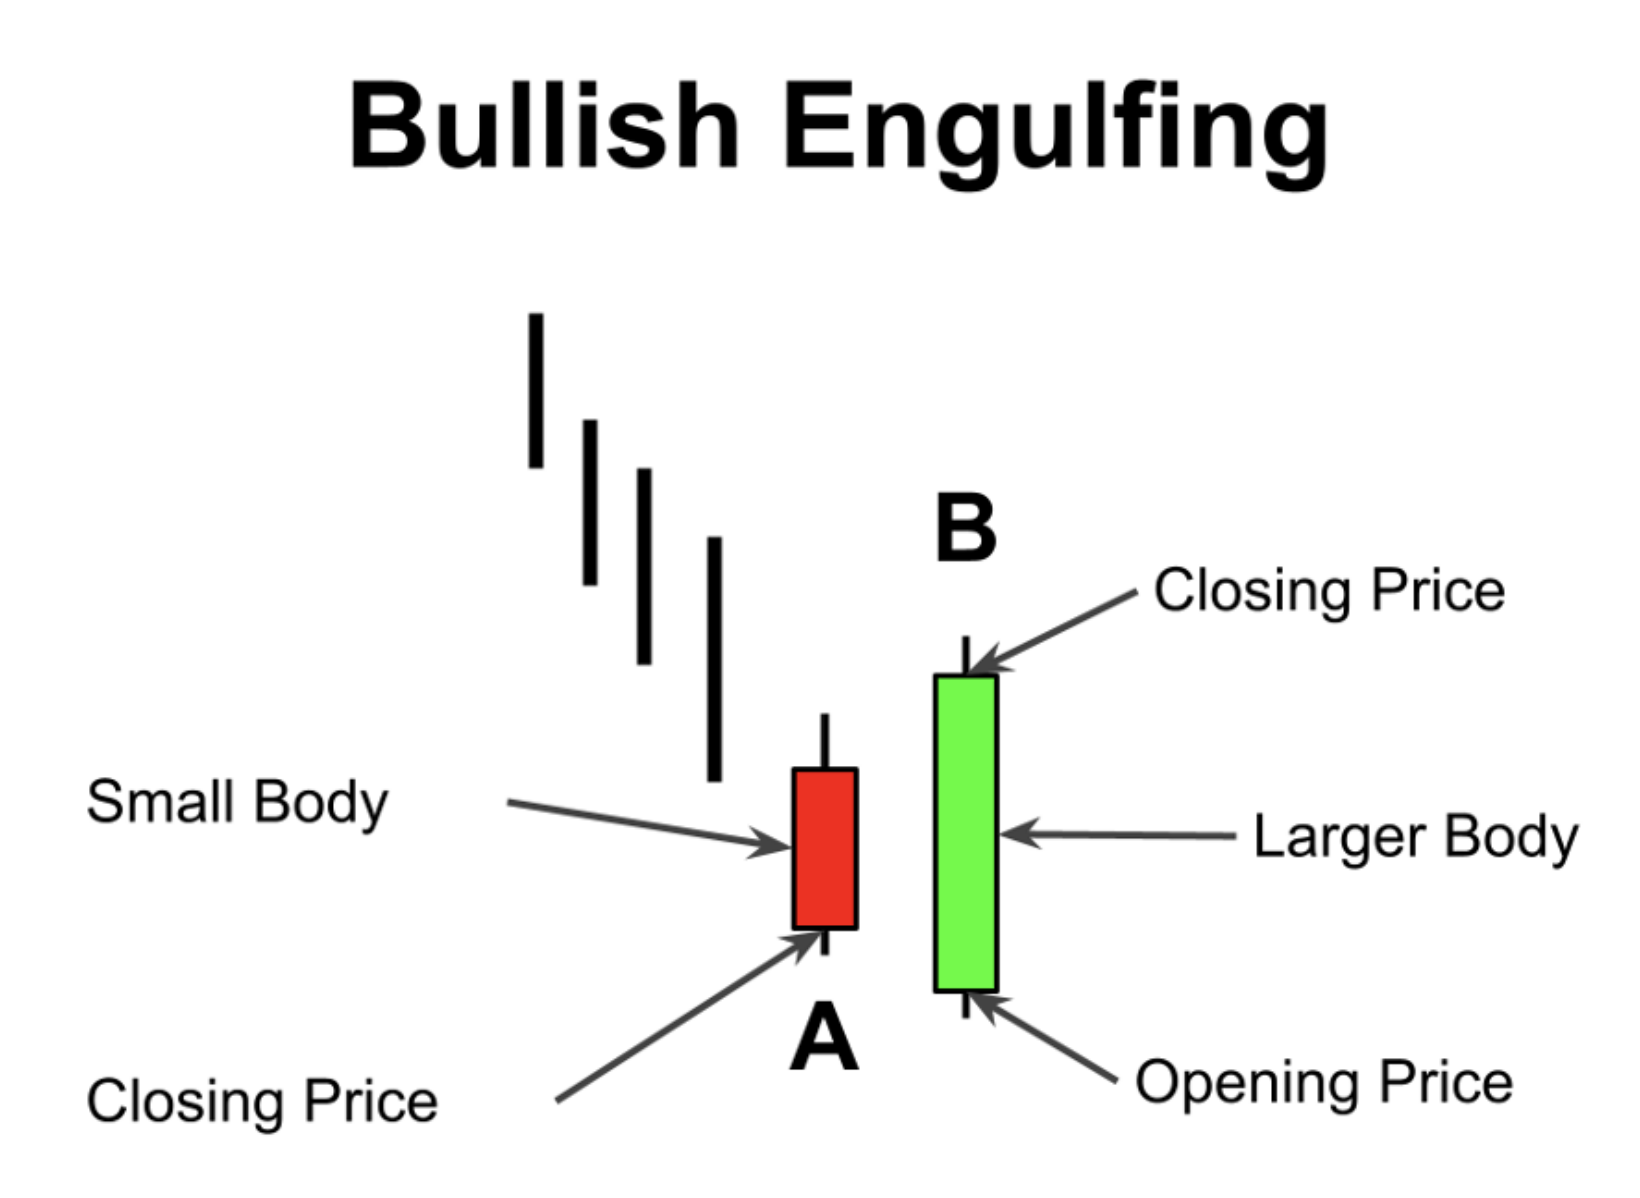
Traders may interpret this pattern as a signal to buy or close a short position. To effectively utilize the bullish engulfing pattern, traders often look for additional confirmation signals such as increased trading volume and the presence of other technical indicators. By incorporating these additional factors, traders can make more informed decisions and increase the accuracy of their trading strategies.
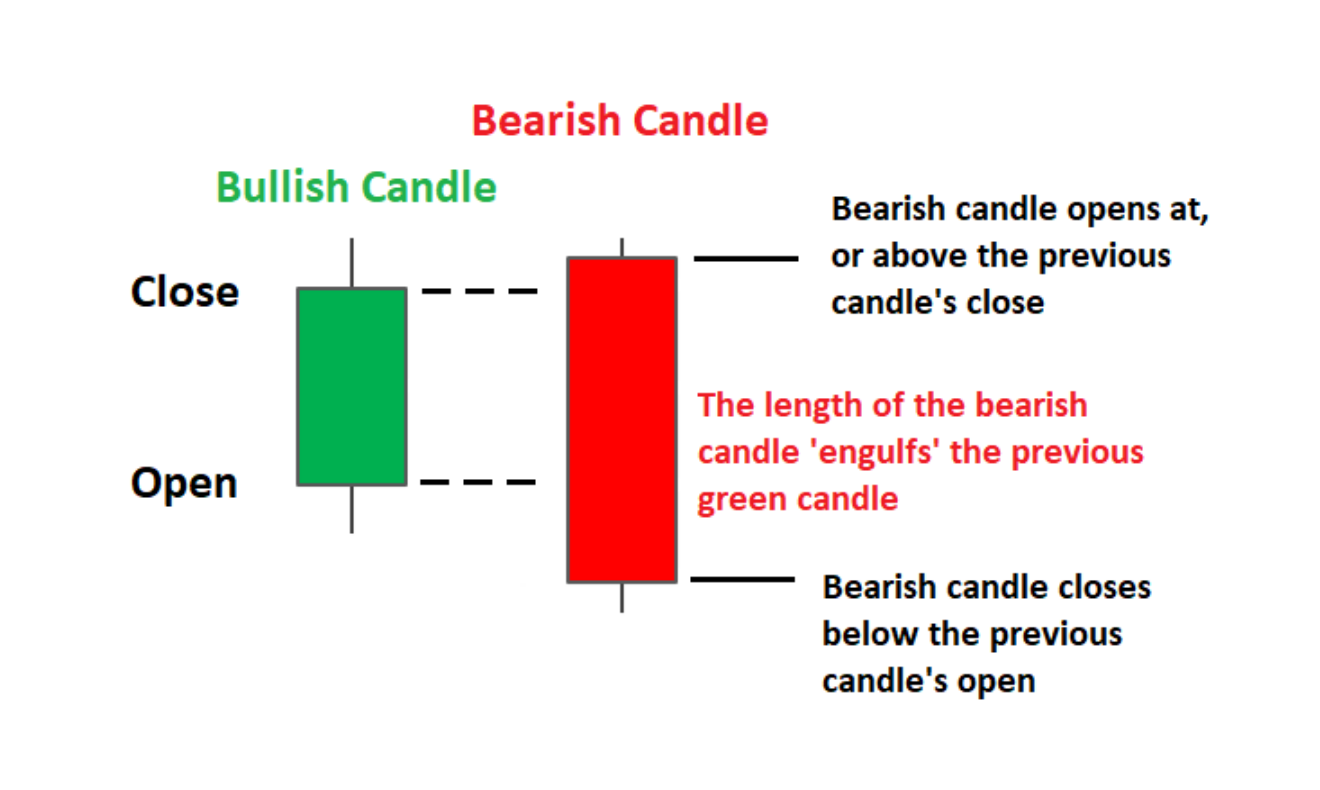
Bearish Engulfing Pattern
A bearish engulfing pattern is a candlestick pattern that suggests a potential reversal in the market trend. It occurs when a small bullish candle is followed by a larger bearish candle that completely engulfs the previous candle. This pattern indicates that bears have taken control of the market and may push prices further down. Traders often use the bearish engulfing pattern as a signal to enter a short position or close a long position.
When trading bearish engulfing patterns, it is important to avoid common mistakes such as trading solely based on this pattern without considering other technical indicators or fundamental analysis. Additionally, identifying key support levels can be helpful in confirming the validity of a bearish engulfing pattern and determining potential price targets or stop-loss levels. These support levels can be identified by looking at previous price levels where the market had difficulty breaking below.
Trading Strategies
One effective approach to trading strategies involving candlestick patterns is to combine them with other technical indicators and fundamental analysis to increase the probability of successful trades. When using engulfing candlestick patterns, it is important to consider the volume indicators in order to confirm the strength of the trend. Volume indicators provide information about the number of shares or contracts traded during a given period, indicating the level of market participation.
By incorporating volume indicators alongside engulfing candlesticks, traders can gain a clearer understanding of the strength of a trend and the likelihood of a successful trade. Additionally, it is beneficial to integrate engulfing candlesticks with other technical analysis tools such as moving averages, trend lines, and support and resistance levels. This combination of indicators and analysis tools provides a more comprehensive view of the market and can assist in making informed trading decisions.
Frequently Asked Questions
What are some common mistakes to avoid when trading with engulfing candlestick patterns?
Some common mistakes to avoid when trading with engulfing candlestick patterns include:
1) Failing to wait for confirmation: It is important to wait for the engulfing pattern to fully form before making a trading decision.
2) Ignoring the trend: Engulfing patterns should be traded in the direction of the prevailing trend to increase the probability of success.
3) Not considering volume: Volume can provide confirmation of the pattern’s strength and should be analyzed alongside the engulfing pattern.
4) Placing stops too far or too close: Proper placement of stop-loss orders should be based on the wicks of the engulfing candles and support/resistance levels.
How reliable are engulfing candlestick patterns in predicting market reversals?
Engulfing candlestick patterns have been widely used in market analysis, but their reliability in predicting market reversals is a subject of debate. Studies have shown mixed results regarding the effectiveness of engulfing candlestick patterns. Some research suggests that these patterns can be reliable indicators of reversals, while others argue that their predictive power is limited.
It is important for traders to consider other technical indicators and confirmatory signals before making trading decisions solely based on engulfing candlestick patterns. Further research and analysis are needed to determine the true effectiveness of these patterns in market analysis.
Are engulfing candlestick patterns more effective in certain timeframes or markets?
Engulfing candlestick patterns can be effective in both trending and ranging markets. In trending markets, bullish engulfing patterns indicate potential reversals and entry points for long positions, while bearish engulfing patterns signal potential reversals and entry points for short positions.
In ranging markets, engulfing patterns can also provide signals for potential reversals, but they may be less reliable due to the lack of a clear trend. The success rates of engulfing candlestick patterns may vary across different timeframes, with shorter timeframes often yielding higher success rates due to the increased frequency of patterns.
Can engulfing candlestick patterns be used in conjunction with other technical indicators?
Using engulfing candlestick patterns alongside trend indicators can be a useful approach in technical analysis. Combining the information provided by engulfing candlestick patterns with trend indicators such as moving averages or trend lines can help confirm potential trend reversals.
Additionally, incorporating support and resistance levels can further enhance the analysis by providing key levels where price may react. By considering these additional technical indicators, traders can gain a more comprehensive understanding of market dynamics and make more informed trading decisions.
Are there any specific risk management strategies to consider when trading with engulfing candlestick patterns?
When trading with engulfing candlestick patterns, it is important to consider specific risk management strategies. These strategies can help traders mitigate potential losses and protect their capital. One approach is to set a stop-loss order below the low of the bearish engulfing pattern or above the high of the bullish engulfing pattern.
This helps limit losses if the market moves against the trader’s position. Additionally, traders can use entry and exit signals provided by other technical indicators to confirm the validity of the engulfing pattern before entering or exiting a trade.