In the world of futures trading, understanding volume analysis is crucial for making informed decisions. One valuable tool that provides deep insights into transactional volume is the footprint chart. These charts reveal the dynamic interaction between buyers and sellers within a specific timeframe, offering traders a comprehensive view of market activity.
By utilizing different types of footprint charts such as bid/ask, volume profile, and delta, traders can gain additional transactional information to guide their strategies. This article serves as a comprehensive guide to footprint charts, exploring their various types, trading strategies, customization options, and risk considerations. By delving into the intricacies of order flow, identifying support and resistance levels, and anticipating price expansion, traders can harness the power of footprint charts to uncover potential opportunities in the futures market.
Key Takeaways
- Footprint charts analyze transactional volume inside a given timeframe and uncover opportunities by looking at the interaction between buyers and sellers.
- There are several types of footprint charts, including bid/ask, volume profile, and delta, which show the volume traded at a precise price level within a candlestick.
- Traders can use footprint charts to analyze order flow, identify areas of support/resistance, and identify points that precede price expansion.
- Imbalances, order blocks, and high volume nodes are key areas to analyze on footprint charts, as they can indicate support/resistance levels and areas of liquidity.

What are Footprint Charts?
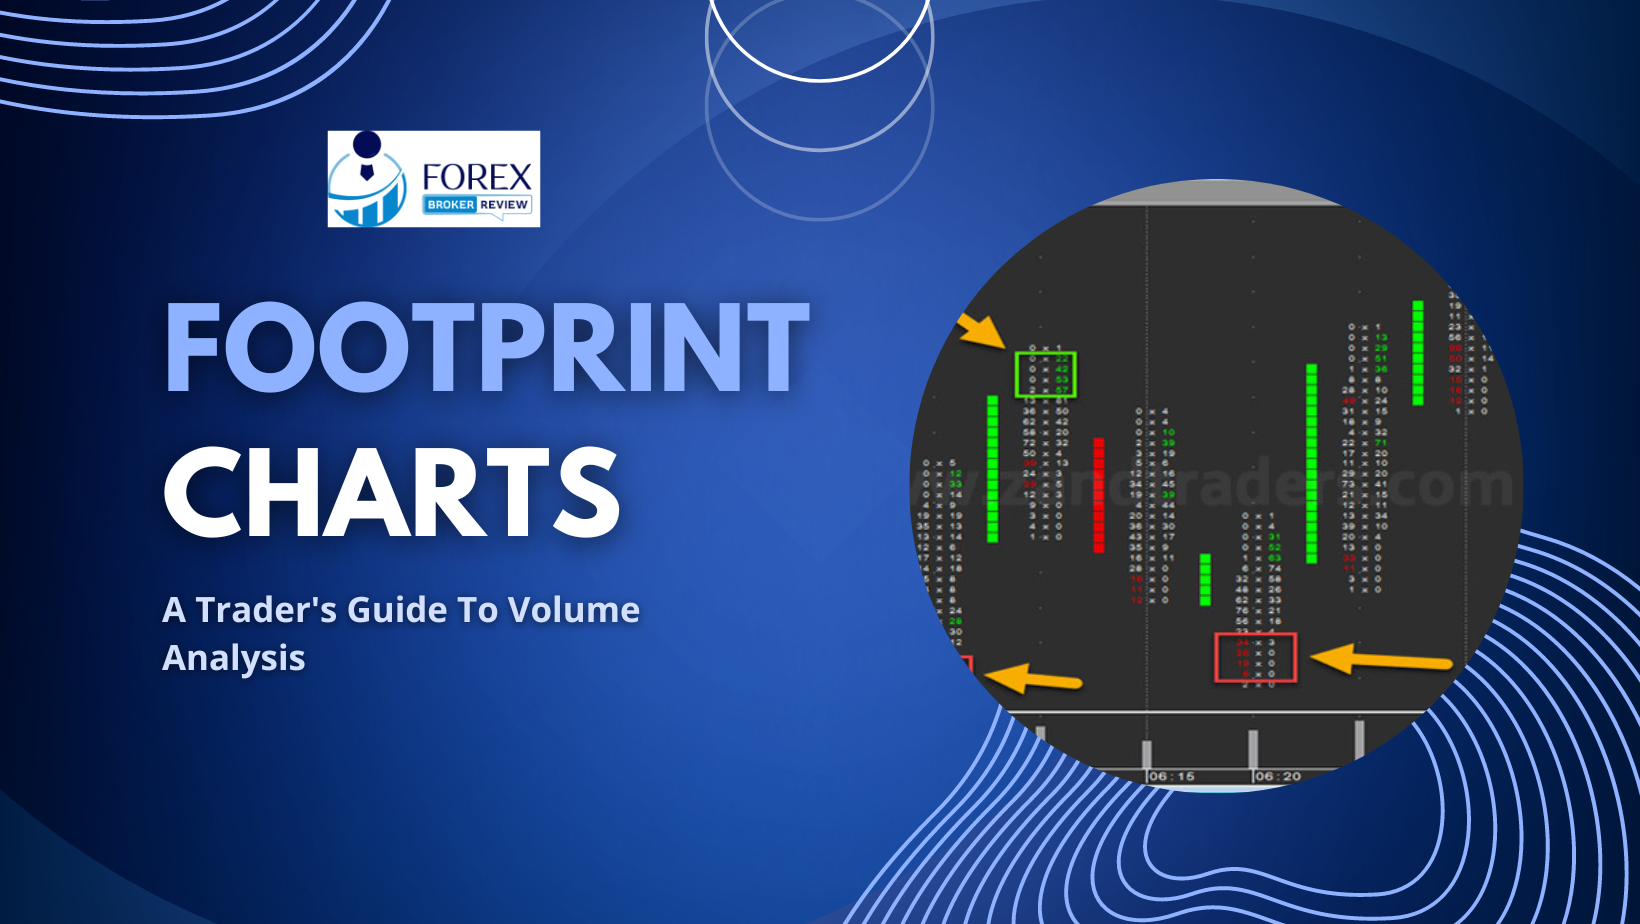
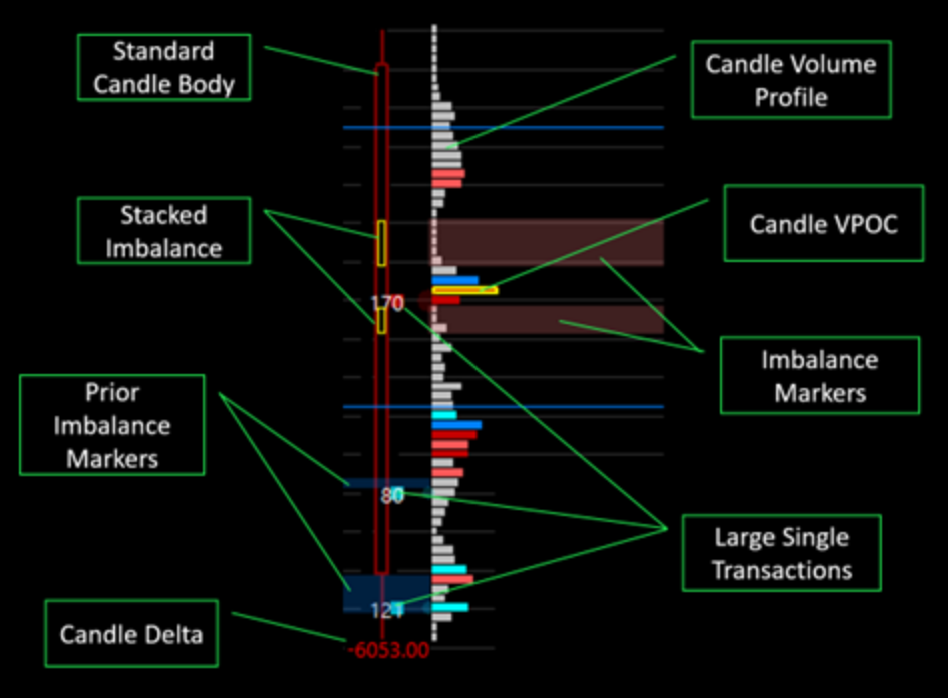
Footprint charts are multidimensional candlestick charts that provide additional transaction information by displaying the volume traded at a precise price level within a candlestick, allowing investors to analyze the executed orders and the interaction between buyers and sellers. These charts offer several advantages in volume analysis. Traders can use footprint charts to analyze order flow, identify areas of support and resistance, and pinpoint points that precede price expansion.
By examining the interaction between buyers and sellers, traders can uncover opportunities for trading. To interpret footprint chart patterns, traders look for certain indicators such as stacked imbalances on bid/ask profiles, which indicate support or resistance levels. They also analyze unfinished auctions, where a certain price sees only buyers or sellers, indicating an unfinished auction. Additionally, high volume areas on footprint charts can act as support, resistance, and attraction nodes to the current price.
Types of Footprint Charts
One can explore the diverse landscape of transactional volume analysis by delving into the various manifestations of these intricate visual representations. Footprint charts offer a unique perspective on volume analysis by providing a multidimensional view of the market. They allow traders to analyze the interaction between buyers and sellers at a precise price level within a candlestick.
Compared to other volume analysis tools such as bid/ask and volume profile charts, footprint charts offer several benefits. They provide more detailed information about executed orders, allowing for a deeper understanding of order flow. Additionally, footprint charts can help identify areas of support and resistance, as well as points that precede price expansion. Their ability to uncover these opportunities makes them a valuable tool for futures traders.
| Footprint Chart Type | Description |
|---|---|
| Volume Footprint Chart | Displays volume traded at each price level. Each price level has a bar representing the total volume traded, with colors indicating whether the market traded at the bid (sell) or ask (buy) price. |
| Delta Footprint Chart | Represents the difference between buying and selling volume at each price level. Positive delta means more volume traded at the ask price, indicating buying pressure, while negative delta shows more volume traded at the bid price, indicating selling pressure. |
| Imbalance Footprint | Focuses on order imbalances between buy and sell volumes at the bid and ask. It identifies situations where there are significant differences in volume, potentially signaling potential price movements. |
| Time-based Footprint | Aggregates volume data over specific time intervals, such as 5-minute or 15-minute bars, providing a different perspective on volume activity during various periods throughout the trading session. |
| Bid-Ask Footprint | Illustrates the volume traded at the bid and ask prices separately, giving insight into the liquidity and aggressiveness of buyers and sellers at specific price levels. |
| Cluster Footprint | Combines price and volume information, showing clusters of volume at different price levels. Traders can identify areas of high liquidity and significant trading interest, which may act as support or resistance levels. |
| Historical Footprint | Provides historical data on footprint charts, allowing traders to analyze past trading activity and its impact on price movements. This helps in understanding market behavior and identifying patterns for future trading opportunities. |
Strategies for Trading with Footprint Charts
Strategies for trading with footprint charts involve identifying stacked imbalances, unfinished auctions, and high volume nodes to uncover potential trading opportunities. Stacked imbalances on bid/ask profiles indicate support or resistance levels. Traders can look for areas where the volume of buyers or sellers is significantly higher than the other side, suggesting a potential imbalance in the market.
Unfinished auctions occur when a certain price sees buyers or sellers only, indicating an unfinished price discovery process. These unfinished auction areas can act as support or resistance levels in future price movements. Additionally, high volume areas on footprint charts can serve as support, resistance, or attraction nodes to the current price. By analyzing these key areas on footprint charts, traders can make more informed trading decisions.
Customization and Options in Footprint Charts
Customization options in footprint chart analysis allow traders to tailor the chart to their specific preferences and trading strategies, enhancing their ability to uncover potential opportunities and make informed trading decisions. Some of the benefits of customizing footprint charts include:
- Advanced Filtering: Traders can customize the chart to filter out noise and focus on specific price levels or volume patterns that are relevant to their analysis.
- Visual Preferences: Traders can choose different color schemes, chart styles, and display options to suit their visual preferences and improve readability.
- Indicator Integration: Customization options enable traders to integrate various technical indicators into the footprint chart, providing additional insights and confirming signals.
- Data Presentation: Traders can customize the way data is presented, such as the size and shape of footprint bars, to highlight key levels or patterns.
By exploring advanced options for analyzing volume with footprint charts, traders can gain a deeper understanding of order flow dynamics, identify areas of support and resistance, and detect potential price expansions.
Risk and Considerations
Risk and considerations should be carefully evaluated when utilizing footprint chart analysis in trading strategies. Effective risk management is crucial when interpreting order flow and making trading decisions based on footprint charts. Traders should be aware that trading futures and options involve a risk of loss and may not be suitable for all investors. It is important to have a clear understanding of the potential risks involved and to have a well-defined risk management strategy in place.
Additionally, interpreting order flow using footprint charts requires a thorough understanding of the market dynamics and the ability to accurately analyze the interaction between buyers and sellers. Traders should also consider the limitations of footprint charts and understand that they are just one tool among many in a trader’s toolbox. By carefully considering these factors and incorporating sound risk management practices, traders can effectively utilize footprint chart analysis in their trading strategies.
Frequently Asked Questions
How do I interpret the interaction between buyers and sellers on a footprint chart?
Interpreting the interaction between buyers and sellers on a footprint chart involves analyzing price action and identifying market sentiment. This can be done by examining the volume traded at specific price levels within the chart and observing patterns and imbalances that indicate support or resistance levels.
Can footprint charts be used for trading other than futures?
Footprint charts can be used for trading in alternative markets, not just futures. They offer advantages such as analyzing order flow and identifying support/resistance levels. However, their effectiveness may vary depending on the specific market and trading strategy employed.
How can I customize a footprint chart to suit my trading preferences?
To customize a footprint chart to suit your trading preferences, you can adjust the settings and parameters of the charting software. This includes customizing indicators and analyzing price patterns to align with your specific trading strategy and preferences.
Are there any additional options available for trading directly from a footprint chart?
One additional option available for trading directly from a footprint chart is the ability to use order chart trading and order entry menu options. This allows traders to place trades directly from the chart, streamlining the trading process. Best practices for using footprint charts include analyzing order flow, identifying areas of support/resistance, and using high volume nodes as reference points.
What are some important risk considerations when trading with footprint charts?
Risk management strategies and psychological factors are important considerations when trading with footprint charts. Traders should implement proper risk management techniques, such as setting stop-loss orders, and be aware of the psychological impact of trading decisions to minimize potential losses and maximize profits.


