Are you tired of searching for the holy grail of trading strategies? Look no further! Introducing the Abandoned Baby Candlestick Pattern, a powerful tool that can unlock the secrets of the financial markets. This pattern is like a beacon in the dark, guiding you towards profitable trades with its uncanny accuracy. The Abandoned Baby Pattern is not your average candlestick formation – it’s a game-changer. With its distinctive characteristics and significant role in market analysis, this pattern has become a favorite among traders worldwide.
In this article, we will delve into the intricacies of the Abandoned Baby Pattern and explore both bullish and bearish trading strategies that can be derived from it. We’ll also discuss how to incorporate this pattern into your decision-making process and highlight the benefits of understanding it in today’s volatile financial markets. So buckle up and get ready for an enlightening journey through the world of candlestick patterns – because mastering the Abandoned Baby Pattern might just be your ticket to trading success.
Key Takeaways
- The abandoned baby candlestick pattern is a distinctive pattern that plays a significant role in market analysis and has a high accuracy rate in predicting trend changes.
- The bullish abandoned baby pattern suggests a reversal from a bearish to a bullish sentiment, indicating that selling pressure is weakening and buyers may soon take control.
- Confirmation of the reversal can be observed through higher volume and a bullish candle after the pattern, providing an opportunity for traders to enter long positions and set stop-loss orders for added protection.
- On the other hand, the bearish abandoned baby pattern is a reliable signal of a potential market shift towards a downtrend, and traders can strategically enter short positions to take advantage of potential downtrends.
Characteristics of the Abandoned Baby Pattern
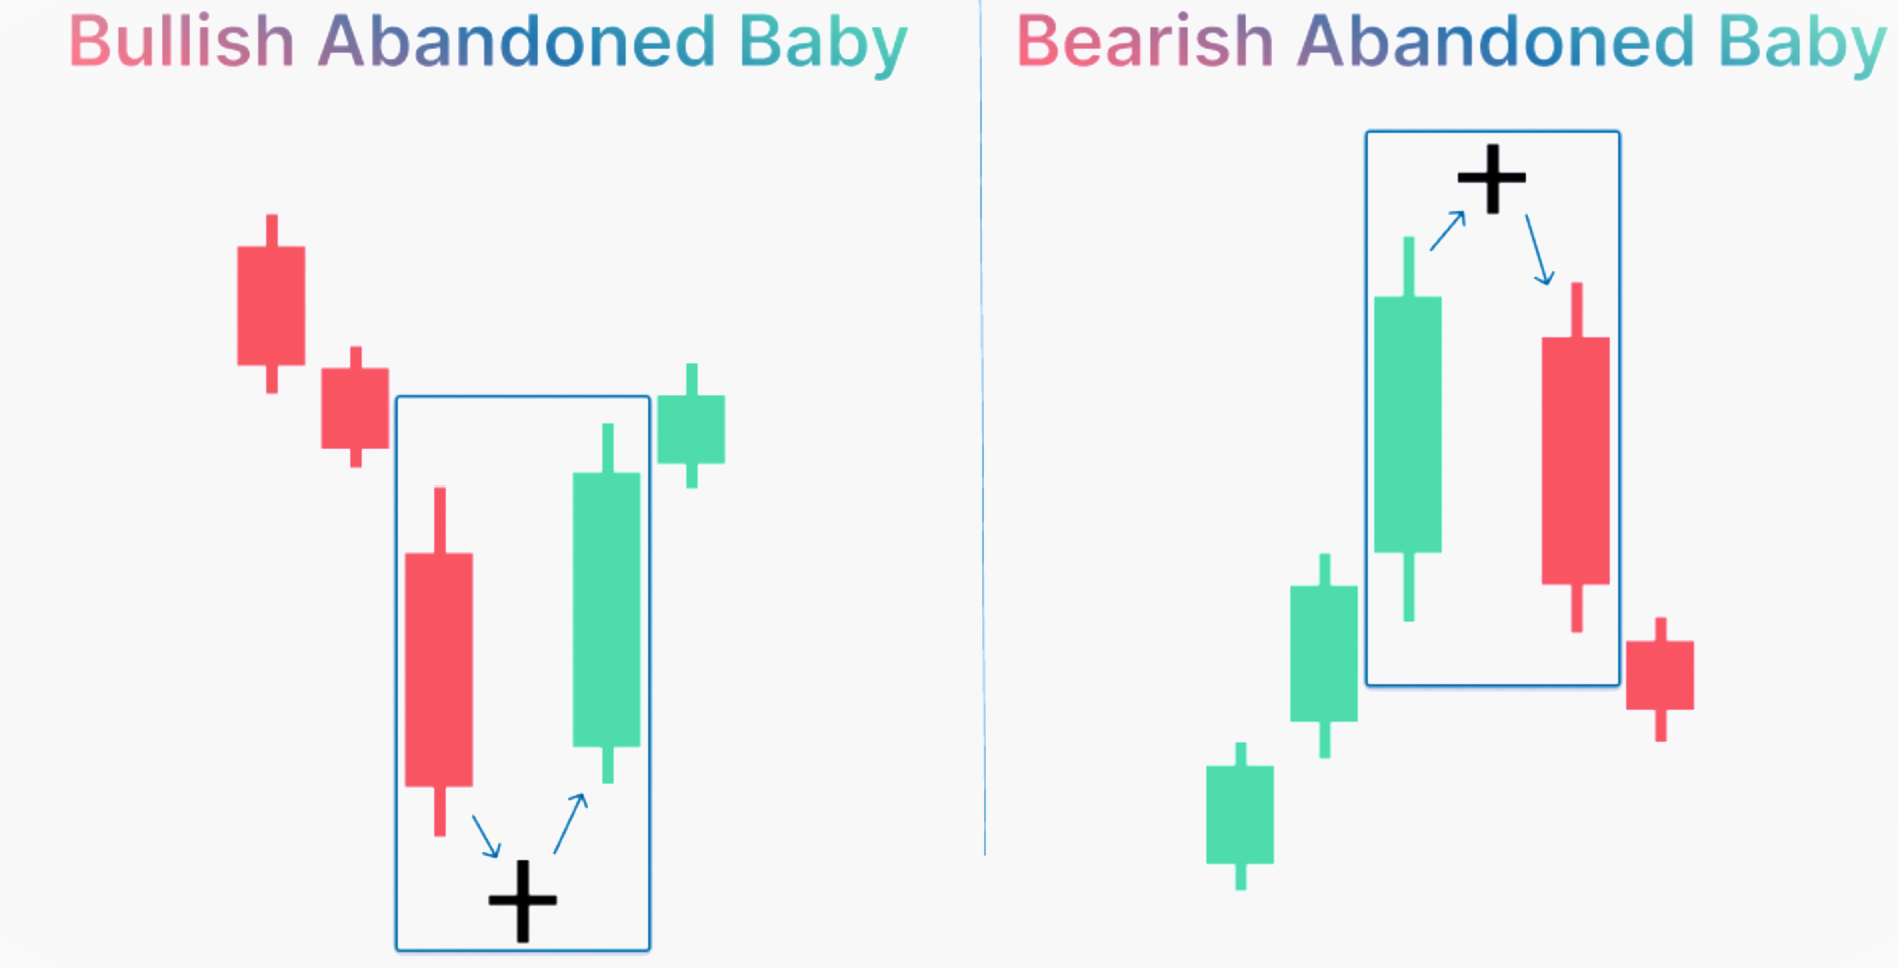
You’ll notice the abandoned baby pattern by its distinct characteristics, such as a small doji candlestick surrounded by two larger candles with gaps on both sides, creating a visual of an abandoned baby in the midst of a market transition. This bullish reversal pattern is often found at the bottom of a downtrend and indicates a potential trend reversal.
The doji candlestick represents indecision in the market, while the two surrounding candles show strong buying or selling pressure. The presence of gaps further emphasizes the sudden shift in sentiment. Candlestick analysis plays a vital role in identifying this pattern as it helps traders gauge market sentiment and make informed decisions. By recognizing and understanding these characteristics, traders can take advantage of potential bullish opportunities that may arise from an abandoned baby pattern.
Significance of the Abandoned Baby Pattern in Market Analysis
Contractions can be a useful tool for traders to identify potential reversals in the market, with one study showing that the abandoned baby pattern had an accuracy rate of over 80% in predicting trend changes. The significance of the abandoned baby pattern in market analysis lies in its ability to indicate a bullish reversal. This candlestick formation consists of three consecutive candles, with the first and third being long and bearish, while the second is a small doji or spinning top.
The doji represents indecision between buyers and sellers, indicating a possible shift in momentum. When this pattern occurs after a downtrend, it suggests that selling pressure is weakening and buyers may soon take control. Traders who recognize this pattern can capitalize on potential bullish opportunities by entering long positions or closing short positions to take advantage of the anticipated trend change.
| Bullish Reversal | Candlestick Formations |
|---|---|
| Abandoned Baby | Doji |
Bullish Trading Strategy using the Abandoned Baby Pattern
Imagine spotting a three-candle formation that signals a potential shift in market momentum, offering you the opportunity to take advantage of an upcoming uptrend. This is what the bullish abandoned baby candlestick pattern offers traders. The pattern consists of a long bearish candle, followed by a doji candle with a gap on both sides, and finally completed by a long bullish candle. It signifies a reversal from bearish to bullish sentiment.
| Strategy Step | Description |
|---|---|
| Step 1 | Identify a downtrend in the price chart. Look for a significant downward movement in the stock’s price over a period of time. |
| Step 2 | Look for a gap down in the price chart. The second candlestick of the pattern should open lower than the previous day’s close, creating a gap between the two candlesticks. |
| Step 3 | Identify the Abandoned Baby pattern. The second candlestick should have a small real body, indicating indecision in the market. The third candlestick should open higher than the second candlestick’s close, leaving a gap between them. This indicates a potential trend reversal. |
| Step 4 | Confirm the pattern. Look for additional bullish signals such as higher trading volume during the formation of the Abandoned Baby pattern. This can provide further confirmation of the potential trend reversal. |
| Step 5 | Enter a long position. Once the Abandoned Baby pattern is confirmed, place a buy order above the high of the third candlestick. This ensures that the price has started to move in the expected direction. |
| Step 6 | Set stop-loss and take-profit levels. Place a stop-loss order below the low of the pattern to limit potential losses. Set a take-profit order at a predetermined target level to secure profits. |
| Step 7 | Monitor the trade. Watch the price action and adjust stop-loss and take-profit levels if necessary. Consider trailing the stop-loss to protect profits as the price continues to rise. |
| Step 8 | Exit the trade. Close the position when the price reaches the predetermined take-profit level or if the trade is no longer following the expected bullish trajectory. |
To implement a bullish trading strategy using the abandoned baby pattern, one must wait for confirmation of the reversal. This can be done by observing higher volume during the formation and ensuring that the next candle after the pattern is also bullish. Traders may consider entering long positions at this point, setting stop-loss orders below the low of the doji or below previous swing lows for added protection.
By incorporating candlestick analysis and identifying patterns like the abandoned baby, traders can enhance their chances of profiting from potential trend reversals in bull markets.
Bearish Trading Strategy using the Abandoned Baby Pattern
To effectively utilize the bearish trading approach, you can analyze the three-candle formation known as the abandoned baby pattern. This pattern is a reliable signal of a potential market shift towards a downtrend. By identifying this short-term bearish strategy, you can take advantage of market reversals and make profitable trades.
| Strategy Step | Description |
|---|---|
| Step 1 | Identify an uptrend in the price chart. Look for a significant upward movement in the stock’s price over a period of time. |
| Step 2 | Look for a gap up in the price chart. The second candlestick of the pattern should open higher than the previous day’s close, creating a gap between the two candlesticks. |
| Step 3 | Identify the Abandoned Baby pattern. The second candlestick should have a small real body, indicating indecision in the market. The third candlestick should open lower than the second candlestick’s close, leaving a gap between them. This indicates a potential trend reversal. |
| Step 4 | Confirm the pattern. Look for additional bearish signals such as higher trading volume during the formation of the Abandoned Baby pattern. This can provide further confirmation of the potential trend reversal. |
| Step 5 | Enter a short position. Once the Abandoned Baby pattern is confirmed, place a sell order below the low of the third candlestick. This ensures that the price has started to move in the expected direction. |
| Step 6 | Set stop-loss and take-profit levels. Place a stop-loss order above the high of the pattern to limit potential losses. Set a take-profit order at a predetermined target level to secure profits. |
| Step 7 | Monitor the trade. Watch the price action and adjust stop-loss and take-profit levels if necessary. Consider trailing the stop-loss to protect profits as the price continues to decline. |
| Step 8 | Exit the trade. Close the position when the price reaches the predetermined take-profit level or if the trade is no longer following the expected bearish trajectory. |
Let’s explore how to identify and interpret the abandoned baby pattern in more detail. The table below provides a visual representation of the candlestick pattern:
| Candlestick 1 | Candlestick 2 | Candlestick 3 |
|---|---|---|
| Bullish | Doji or small body with gap down | Bearish |
In the abandoned baby pattern, the first candle is bullish, followed by a doji or small-bodied candle with a gap down from the previous day’s close. Finally, there is a bearish candle that confirms the reversal.
By recognizing this pattern and understanding its implications, you can strategically enter short positions to take advantage of potential downtrends in the market.
Incorporating the Abandoned Baby Pattern into Decision-Making Process
When incorporating the abandoned baby pattern into your decision-making process, it is crucial to recognize its significance and potential impact on market trends. Analyzing candlestick patterns, such as the abandoned baby pattern, can provide valuable insights for traders using technical analysis techniques. This pattern consists of three consecutive candles, with the middle one forming a gap away from the previous and next candles.
The first and third candles have small bodies and appear close together. Bullish or bearish signals can be derived from this pattern depending on whether it appears at the end of an uptrend or downtrend. By understanding the implications of the abandoned baby pattern, traders can make informed decisions about entering or exiting positions in order to capitalize on potential market reversals or continuations.
Benefits of Understanding the Abandoned Baby Pattern in Financial Markets
By gaining a deep understanding of the significance and potential impact of the abandoned baby pattern in financial markets, you can enhance your decision-making process and potentially maximize your trading opportunities. Candlestick chart analysis plays a crucial role in identifying patterns like the abandoned baby pattern, which is characterized by a gap between the previous and current candlesticks with no overlap. This pattern signals a sudden shift in market sentiment, often indicating a reversal or consolidation phase.
By recognizing this pattern, traders can make more informed decisions about their entry and exit points, as well as adjust their risk management strategies accordingly. Additionally, incorporating technical indicators in trading can further strengthen your analysis of the abandoned baby pattern, providing confirmation or divergence signals for increased accuracy. Ultimately, understanding this pattern can give you an edge in the financial markets and improve your overall trading performance.
Frequently Asked Questions
How do I identify the Abandoned Baby pattern in a candlestick chart?
To identify the abandoned baby pattern in a candlestick chart, look for three consecutive candles. The first and third candles should have small bodies with gaps between them, while the middle candle should have a long body. This pattern signals a potential trend reversal.
Can the Abandoned Baby pattern be used in conjunction with other technical indicators for better analysis?
Using the abandoned baby pattern with moving averages is like adding a compass to your map, providing additional direction. Combining it with volume analysis confirms the pattern’s reliability, enhancing your technical analysis strategy.
What are some common mistakes to avoid when trading the Abandoned Baby pattern?
Some common mistakes to avoid when trading the abandoned baby pattern include not waiting for confirmation, ignoring other technical indicators, and failing to set proper stop-loss orders. These mistakes can hinder your trading strategies.
Are there any specific timeframes or markets where the Abandoned Baby pattern works best?
The abandoned baby pattern tends to work best in shorter timeframes, such as intraday or daily charts. It is also commonly observed in forex and stock markets, where it has shown potential for profitable trades.
How reliable is the Abandoned Baby pattern as a standalone trading strategy?
The reliability of the abandoned baby pattern as a standalone trading strategy can vary depending on market conditions. Backtesting this pattern for different market conditions and comparing it with other reversal patterns in candlestick analysis is recommended.