In the realm of financial markets, patterns emerge as subtle clues that can guide traders in making informed decisions. One such pattern is the spinning top candlestick pattern, which serves as a metaphor for the indecisiveness that often plagues market participants. Like a spinning top toy, this formation reflects the tug-of-war between buyers and sellers, leaving the future trend direction uncertain.
With its long wicks and a short body, the spinning top pattern symbolizes a neutral stance, indicating a potential reversal or continuation of the prevailing trend. However, its true significance lies in the candle that follows, as it reveals the market’s ultimate resolve. By understanding the formation, characteristics, and implications of the spinning top pattern, traders can gain valuable insights into market sentiment and make informed trading decisions.
In this article, we delve into the intricacies of the spinning top candlestick pattern, exploring its formation, analyzing its characteristics, and uncovering its potential applications in trading strategies.
Key Takeaways
- The spinning top candlestick pattern reflects indecisiveness among buyers and sellers.
- It suggests potential reversal or continuation of the current trend.
- Traders can use the spinning top pattern to identify market turning points.
- The pattern can be analyzed in different time frames and can be enhanced by incorporating other technical indicators and tools.
Credits: thinkmarkets.com
What is The Spinning Top Candle Pattern?
The spinning top candlestick pattern is a formation characterized by a single candle with long wicks and a short body, indicating indecision among buyers and sellers regarding the future trend direction. This pattern holds importance in technical analysis as it suggests a potential reversal or continuation of the current trend. Traders often look for spinning top patterns to identify potential market turning points.
The pattern can be identified in different time frames, from intraday charts to longer-term charts. It is crucial to consider the context and the surrounding market conditions when interpreting the spinning top pattern. Traders may also analyze the next candlestick formation to determine the possible direction of the market. Overall, the spinning top candlestick pattern serves as a valuable tool for traders to assess market sentiment and make informed trading decisions.
Formation and Characteristics of Spinning Top Candlestick
One notable aspect of the spinning top formation is its short body relative to the long wicks, with the average length of the body being approximately 20% of the total candle length. This characteristic creates a visual representation of the indecision and uncertainty in the market.
To identify a spinning top pattern, traders look for a candlestick with long upper and lower wicks and a short body. The length of the wicks indicates the range of price movement during the trading session, while the body represents the opening and closing prices.
Differentiating the spinning top pattern from other candlestick patterns can be done by considering the length of the wicks and the size of the body. The spinning top has longer wicks and a shorter body compared to other patterns like doji or hammer. This distinction helps traders recognize the unique characteristics and potential implications of the spinning top pattern.
Trading and Analysis (Spinning Top Candlestick)
Traders often analyze the spinning top formation to identify potential trading opportunities and make informed decisions based on the market’s indecisiveness. Technical indicators can be used to confirm the validity of the spinning top pattern. For instance, traders may look for confirmation from volume indicators, such as the on-balance volume (OBV), which measures buying and selling pressure. Additionally, oscillators, like the relative strength index (RSI), can be used to assess the overbought or oversold conditions of the market.
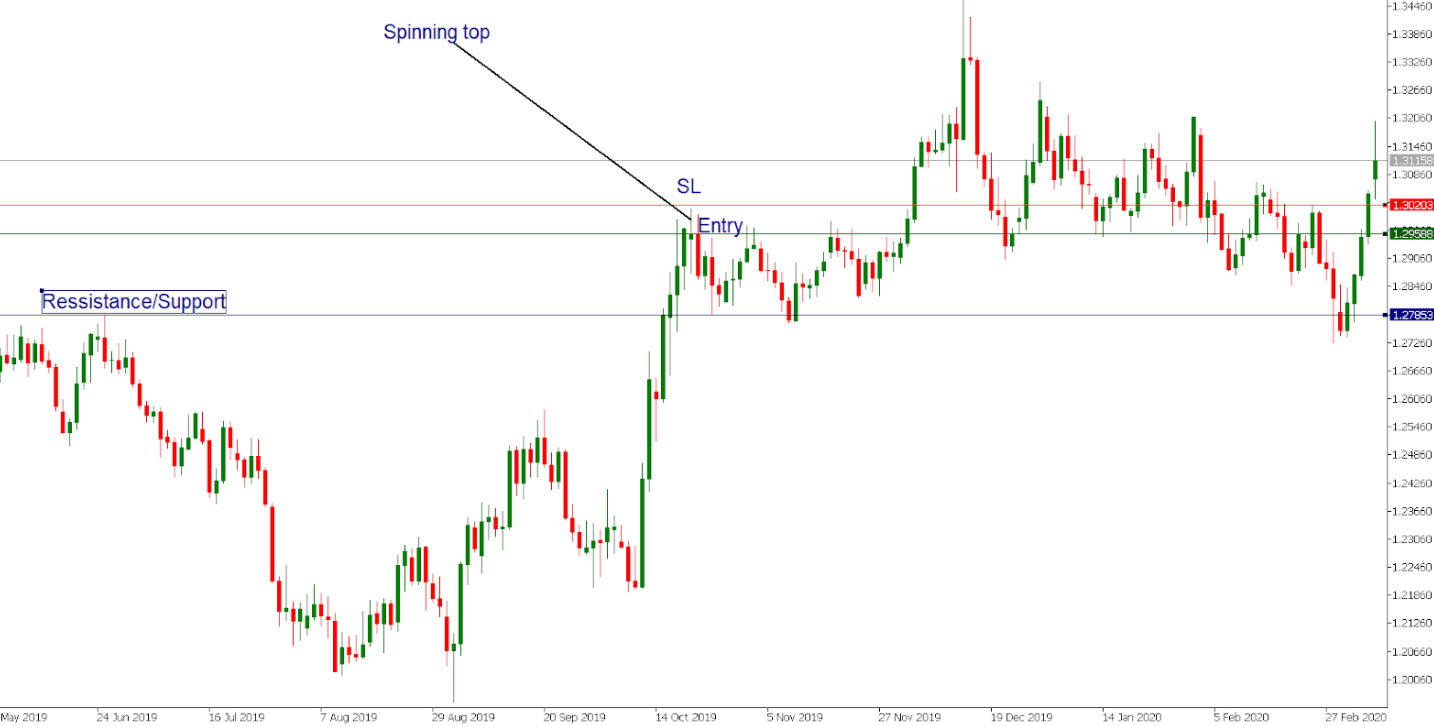
Furthermore, the spinning top pattern can be applied in different timeframes. In shorter timeframes, such as intraday trading, traders may use the spinning top pattern to identify potential reversals or breakouts. On the other hand, in longer timeframes, such as daily or weekly charts, the spinning top pattern can indicate a potential trend reversal or continuation. Traders may also combine the spinning top pattern with other technical analysis tools, such as trendlines or support and resistance levels, to enhance their trading strategies and increase the likelihood of successful trades.
Frequently Asked Questions
How does the spinning top pattern differ from other candlestick patterns?
The spinning top pattern differs from other candlestick patterns due to its distinguishing features, including a short body and long wicks. It signifies indecision among buyers and sellers and is significant as it can signal a change in trend direction.
Can the spinning top pattern be a reliable indicator of a trend reversal?
The spinning top pattern can be a reliable indicator of a trend reversal depending on various factors. These factors include the prevailing market conditions, volume, and confirmation from subsequent candlestick patterns or technical indicators.
What are some common mistakes to avoid when trading the spinning top pattern?
Common mistakes when trading the spinning top pattern include relying solely on this pattern for decision-making, ignoring other technical indicators, not considering the market context, and failing to set appropriate stop-loss levels and profit targets. Effective trading strategies involve confirming the pattern with additional signals and using proper risk management techniques.
Are there any specific timeframes or markets where the spinning top pattern is more effective?
Intraday trading strategies for the spinning top pattern can be applied across various timeframes and markets. However, it is important to consider the strength of the pattern in trending markets and to be cautious of false signals by analyzing other technical indicators or price action confirmation.
How can traders use other technical indicators in conjunction with the spinning top pattern for more accurate analysis?
When using oscillators with the spinning top pattern, traders can gain more accurate analysis. For example, the Relative Strength Index (RSI) can help identify overbought and oversold conditions. Additionally, identifying support and resistance levels can enhance the analysis of the spinning top pattern.