In the vast and ever-evolving world of financial markets, traders and investors are constantly seeking reliable indicators to guide their decisions. One such indicator that has gained popularity is the Keltner Channel. While it may not be as well-known as its counterpart, the Bollinger Bands, the Keltner Channel possesses its own unique advantages.
The Keltner Channel is a powerful tool that aids in timing entries and predicting market turning points. By utilizing upper and lower channel lines, derived from the average true range (ATR), and a middle line consisting of a 20-period exponential moving average (EMA), this indicator provides traders with valuable insights into market conditions.
However, it is crucial to approach the Keltner Channel with an analytical mindset, as relying solely on the price being at the upper band can be misleading. Instead, traders should consider factors such as price rejections at key market structure levels and closure outside the channel to identify potential reversals.
Moreover, incorporating a 200-period moving average can further confirm market conditions and enhance the accuracy of predictions. In addition, traders can capitalize on low market volatility and breakout opportunities through the Keltner Channel Squeeze, where the price becomes trapped between the outer and middle channel lines.
By employing the Keltner Channel in conjunction with other technical analysis tools, traders can enhance their timing and prediction abilities, ultimately empowering them to make informed decisions in the dynamic world of financial markets.
Key Takeaways
- The Keltner Channel is a trading indicator used for timing entries and predicting market turning points.
- It is important to not buy just because the price is at the upper band of the Keltner Channels.
- Price reversals usually occur when the price closes outside the Keltner Channel and at market structure levels like support and resistance.
- The Keltner Channel Squeeze occurs when the price gets trapped between the outer and middle channel lines, indicating low market volatility.
What is Keltner Channel Indicator?
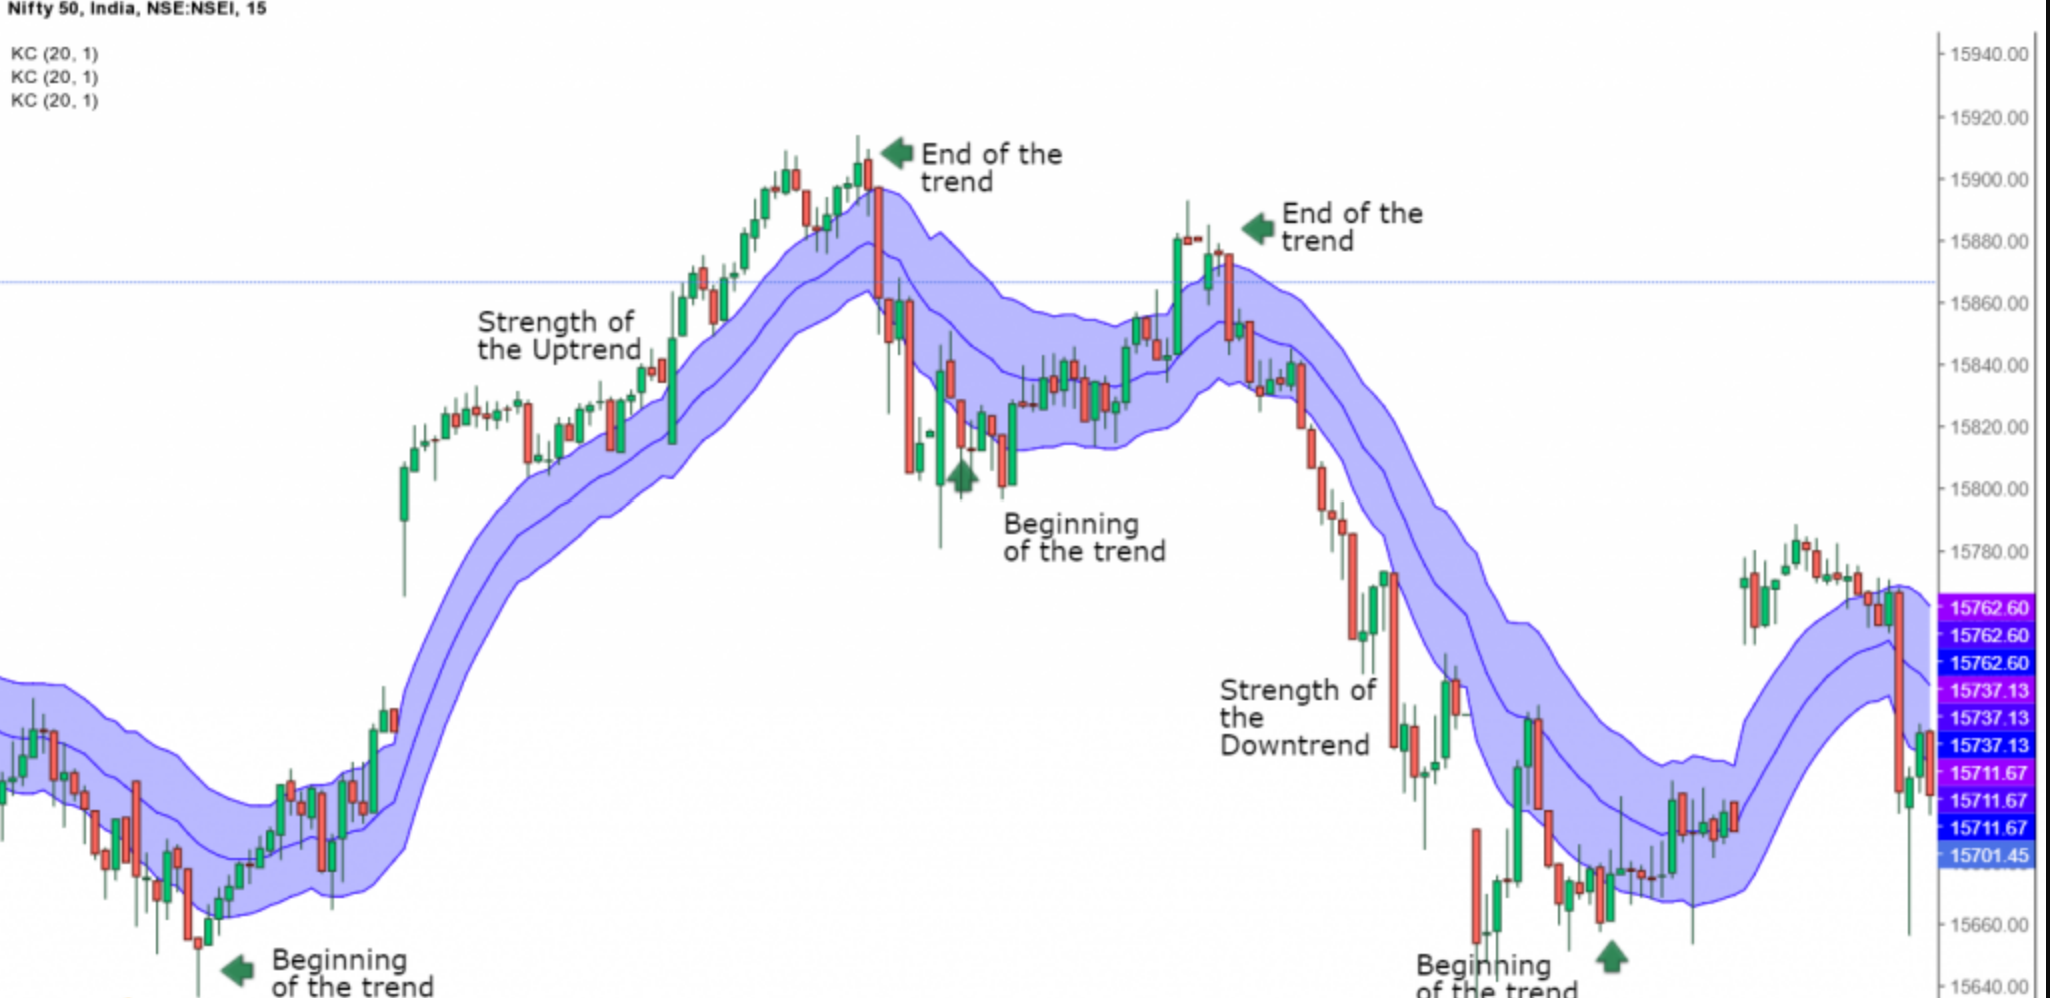
The Keltner Channel is an envelop-based trading indicator with upper and lower boundaries that is used for timing entries and predicting market turning points, and it is known for its smoother nature compared to Bollinger Bands. The indicator consists of a middle line, which is typically a 20-period exponential moving average (EMA), and upper and lower channel lines that are calculated by adding and subtracting twice the average true range (ATR) from the middle line.
One of the advantages of the Keltner Channel is its ability to identify different market conditions, such as uptrends, downtrends, and ranges. Additionally, it can provide signals for potential reversals when the price closes outside the channel and at key market structure levels like support and resistance.
However, it is important to note that the Keltner Channel should not be solely relied upon for buy or sell decisions. Price reversals can occur when the price closes outside the outer channel line, but confirmation from other technical indicators or market factors is recommended.
Common misconceptions about the Keltner Channel include assuming that buying when the price reaches the upper band is a profitable strategy, and neglecting the importance of market structure levels and price rejection. It is crucial to interpret the Keltner Channel in conjunction with other indicators and market analysis for optimal trading decisions.
How Keltner Channel Works
One potential objection to using the Keltner Channel is that it may be difficult to accurately time market turning points based solely on the indicator’s upper and lower boundaries. However, by combining the Keltner Channel with other technical analysis tools, traders can increase their chances of identifying potential reversals and improving their market timing.
Benefits of using the Keltner Channel:
- Helps identify different market conditions such as uptrend, downtrend, or range.
- Can be used to time entries in a strong trend by buying the breakout or trading the pullback.
- Provides smoother signals compared to Bollinger Bands.
- Can be used in conjunction with a 200-period moving average to confirm the market condition.
Limitations of using the Keltner Channel:
- It is important not to buy just because the price is at the upper band of the Keltner Channels.
- Price reversals usually occur when the price closes outside the Keltner Channel and at market structure levels like support and resistance.
- False signals can occur, so it is important to use additional confirmation indicators.
- The Keltner Channel Squeeze may indicate low market volatility, but it does not guarantee a breakout.
Keltner Channel: Trading strategies
Trading strategies utilizing the Keltner Channel focus on identifying market conditions, timing entries, and predicting potential reversals. The Keltner Channel can be used in different market conditions, such as uptrends, downtrends, or range-bound markets. When combined with other indicators, it can provide more comprehensive analysis and increase the accuracy of trading signals. One common approach is to add a 200-period moving average to the Keltner Channel to confirm the market condition.
| Strategy Name | Description |
|---|---|
| Keltner Breakout | Buy when the price closes above the upper band of the Keltner Channel and sell when it closes below the lower band. This indicates a potential breakout in the direction of the trend. |
| Keltner Squeeze | Identify periods of low volatility when the Keltner Channel’s width narrows (bands are close together). Prepare for potential high volatility and a significant price movement when the bands expand. Consider buying or selling depending on the direction of the breakout. |
| Keltner Trend Following | Use the position of the price relative to the midline of the Keltner Channel (EMA) to determine the trend. When the price is above the EMA, consider only long positions, and when the price is below the EMA, consider only short positions. |
| Keltner Pullback | After a significant price move, wait for a pullback to the midline (EMA) of the Keltner Channel. Buy (or sell) when the price bounces off the midline and resumes the primary trend in the direction of the breakout. |
| Keltner Crossover | Use two Keltner Channels with different parameters, e.g., one with a shorter period and one with a longer period. Generate buy signals when the shorter-term channel crosses above the longer-term channel and sell signals when the shorter-term channel crosses below the longer-term channel. |
| Keltner RSI Divergence | Combine the Keltner Channel with the Relative Strength Index (RSI). Look for divergences between the price action and the RSI readings. When the price makes a new high, but the RSI does not, it could signal a potential reversal. |
| Keltner Mean Reversion | Identify overextended price moves beyond the Keltner Channel’s bands and anticipate a reversal to the mean. Sell (or buy) when the price reaches the outer bands and shows signs of reversing back towards the midline (EMA). |
In trending markets, traders can time their entries by waiting for a pullback towards the 20-period moving average and looking for reversal candlestick patterns. In addition, the Keltner Channel Squeeze can be used to identify low market volatility and anticipate upcoming breakouts. Traders can wait for a breakout during the squeeze or trade the pullback in a strong trend. Overall, the Keltner Channel is a versatile tool that can enhance trading strategies and improve timing in various market conditions.
Frequently Asked Questions
What are the advantages of using the Keltner Channel compared to other technical indicators?
The Keltner Channel Indicator offers several advantages compared to other technical indicators. It provides a smoother representation of price movements, helps identify different market conditions, and can be used to time entries in both trending and volatile markets effectively.
Are there any specific timeframes or market conditions where the Keltner Channel is more effective?
The effectiveness of the Keltner Channel indicator can vary depending on the timeframes and trading conditions. It is commonly used in shorter timeframes for intraday trading and can be more effective in trending markets rather than range-bound markets.
Can the Keltner Channel be used as a standalone indicator, or is it recommended to combine it with other indicators?
The Keltner Channel can be used as a standalone indicator, but it is often recommended to combine it with other indicators for more comprehensive analysis. Combining indicators can provide additional confirmation and enhance the accuracy of trading signals.
How can the Keltner Channel be used to set stop-loss and take-profit levels?
Using the Keltner Channel for trend identification, traders can set stop-loss and take-profit levels by considering price reversals outside the outer channel line and at key market structure levels. Applying the Keltner Channel in different financial markets enhances timing and prediction accuracy.
Are there any common mistakes or pitfalls that traders should be aware of when using the Keltner Channel?
Common mistakes include solely relying on the upper band for buying, ignoring market structure levels, and failing to confirm with a 200-period moving average. Traders should also avoid entering trades during low volatility periods indicated by a Keltner Channel Squeeze.