The inverted cup and handle chart pattern is a widely recognized and bearish pattern in technical analysis. According to historical data, this pattern has shown a high probability of indicating a downward trend in the market. It is characterized by a cup shape followed by a handle that retraces a significant portion of the prior bullish move. Traders often use this pattern as a signal to enter short positions and take advantage of potential price declines.
This article aims to provide a comprehensive understanding of the inverted cup and handle chart pattern and how to effectively trade it. It will delve into the pattern’s key characteristics, including its formation and confirmation criteria. Additionally, various trading strategies will be explored, such as using additional technical indicators to enhance the pattern’s reliability.
It is important to note that while this pattern has historically proven to be a valuable tool in technical analysis, individual trading results may vary. Therefore, traders should exercise caution and consider other factors such as market conditions and their own risk tolerance before making trading decisions.
Key Takeaways
- The inverted cup and handle pattern is a reliable chart pattern indicating a bearish movement in forex and other financial markets.
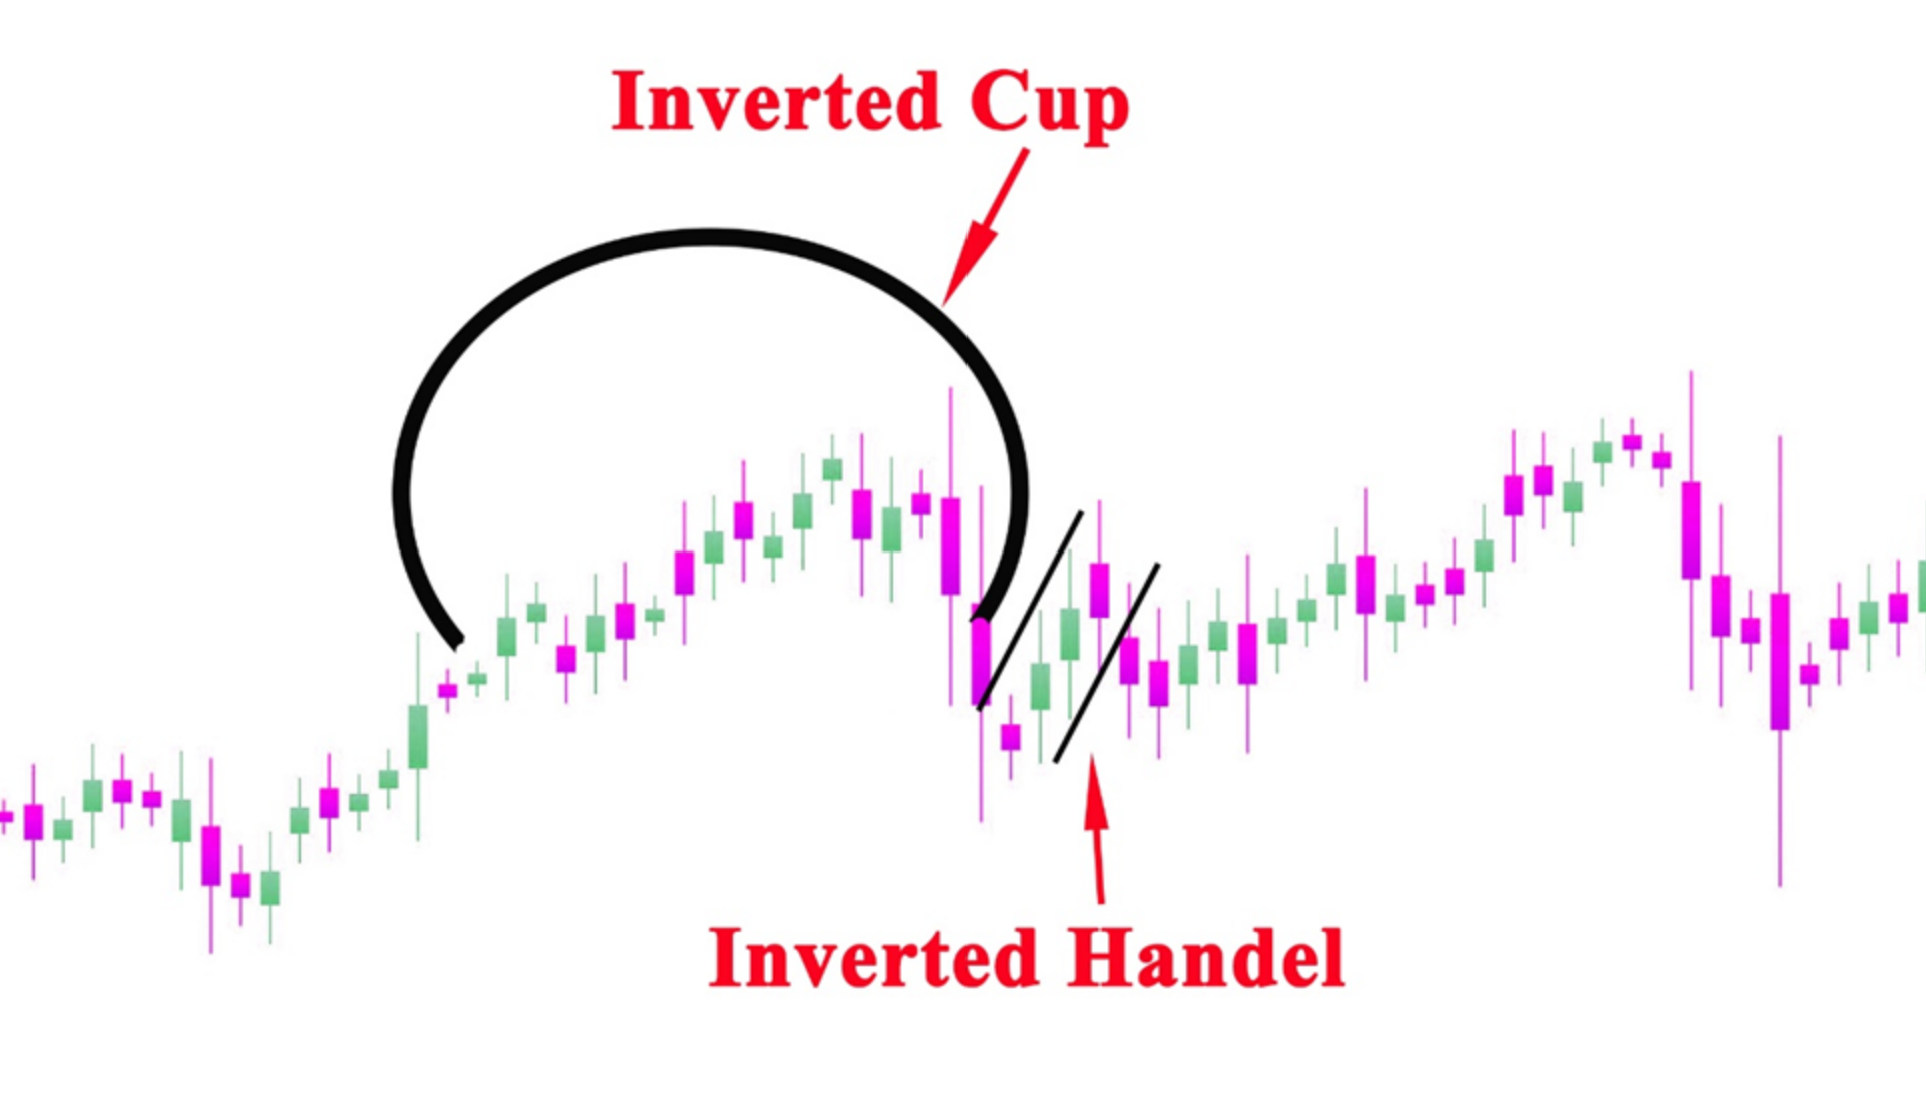
- The pattern consists of a cup and a handle, with the cup shaped like an inverted U or V and the handle retracing about 30-50% of the prior bullish move.
- The pattern is complete when the price breaks below the lower level of the handle or support level.
- Confirmation from other technical indicators such as moving averages, stochastic divergence, and volume can be used to further validate the pattern.
What is the Inverted Cup And Handle Pattern?
The inverted cup and handle pattern is a reliable chart pattern that can be observed in various financial markets, indicating a bearish movement. This pattern consists of a cup and a handle, with the cup shaped like an inverted U or V. The cup has a uniform and smooth depth, while the handle retraces about 30-50% of the prior bullish move. One of the pros of this pattern is its reliability as a sell signal for traders.
However, it is important to note that the profitability of each strategy can vary depending on market conditions. Examples of the inverted cup and handle pattern in action can be seen in forex and other financial instruments on different timeframes. Traders can use confirmation from other technical indicators such as moving averages and stochastic divergence, as well as volume, to further validate this pattern.
Inverted Cup And Handle Pattern Characteristics
Characterized by a distinctive curved formation resembling a cup and accompanied by a subsequent retracement, this chart pattern exhibits a smooth and symmetrical shape, suggesting a potential bearish market movement. The inverted cup and handle pattern can be identified in different financial markets, including forex. Traders analyze the reliability and effectiveness of this pattern in forex trading to determine potential sell signals.
It is important to note that the pattern’s reliability may vary depending on market conditions. Confirmation from other technical indicators, such as moving averages and stochastic divergence, can be used to validate the pattern. Additionally, volume can indicate market activity and further confirm the pattern. Traders should consider these factors when trading the inverted cup and handle pattern in order to maximize profitability and minimize risks.
| Pattern Name | Inverted Cup and Handle |
|---|---|
| Pattern Type | Bullish Continuation Pattern |
| Formation | – Preceded by an uptrend |
| – A large rounded top (cup) forms | |
| – Followed by a smaller downward retracement (handle) | |
| – The handle’s low should not breach the cup’s low (important condition) | |
| Signal Confirmation | – Breakout above the handle’s resistance |
| – Increased trading volume on the breakout | |
| Target | The pattern suggests a continuation of the previous uptrend, and the price target is typically projected by measuring the cup’s depth and adding it to the breakout level. |
| Stop Loss | Traders may set stop-loss orders below the handle’s low to manage risk and protect against potential trend reversals. |
| Timeframe | The pattern can occur on various timeframes, from intraday to longer-term charts. The reliability of the pattern increases on higher timeframes. |
| Note | – It’s essential to confirm the pattern’s validity with volume and price action. |
| – The pattern’s duration may vary, with handles forming over a few days to several weeks. | |
| – The handle’s consolidation should be relatively low and flat compared to the cup’s rounded top. | |
| – False breakouts can occur, so patience and confirmation are essential. |
Trading Strategies Using Inverted Cup And Handle
One effective approach when trading the inverted cup and handle pattern is to incorporate confirmation from various technical indicators. This can help traders identify potential trading entry points and enhance their risk management techniques. Here are three key strategies that can be employed:
- Trend confirmation: Traders can use moving averages as trend indicators to confirm the validity of the pattern. By analyzing the relationship between the price and the moving averages, traders can determine the strength of the bearish movement and make informed trading decisions.
- Stochastic divergence: Traders can also look for signs of stochastic divergence, which occurs when the price and the stochastic oscillator move in opposite directions. This can indicate a potential reversal in the current trend and serve as a confirmation signal for the inverted cup and handle pattern.
- Volume analysis: Analyzing volume can provide insights into market activity and further confirm the pattern. Traders can look for increasing volume during the formation of the cup and handle, indicating strong selling pressure. Conversely, a decrease in volume during the handle formation may suggest a lack of selling interest, potentially invalidating the pattern.
By incorporating these strategies, traders can enhance their trading decisions when trading the inverted cup and handle pattern, improving their chances of success and effectively managing their risk.
Frequently Asked Questions
How do you determine the ideal entry and exit points when trading the inverted cup and handle pattern?
Determining ideal entry and exit points when trading the inverted cup and handle pattern requires a careful analysis of price action, support and resistance levels, and the use of risk management techniques.
Are there any specific risk management techniques or stop-loss strategies that are recommended when trading this pattern?
Risk management techniques and stop-loss strategies are essential when trading the inverted cup and handle pattern. Traders can implement techniques such as setting stop-loss orders at appropriate levels, using trailing stops, and employing proper position sizing to mitigate potential losses and protect capital.
Can the inverted cup and handle pattern be used effectively in conjunction with other chart patterns or technical indicators?
The inverted cup and handle pattern can be effectively used in conjunction with trendlines and support/resistance levels to enhance its reliability. Additionally, exploring the potential of combining the pattern with oscillators like RSI or MACD can provide further confirmation and insight into market trends.
How long does it typically take for the inverted cup and handle pattern to form on different timeframes?
The duration of formation for the inverted cup and handle pattern varies on different timeframes. Market volatility can impact the pattern formation, potentially lengthening or shortening the time it takes for the pattern to fully develop.
Are there any specific market conditions or factors that may invalidate or make the inverted cup and handle pattern less reliable?
The reliability of the inverted cup and handle pattern may be impacted by market volatility and investor sentiment. High levels of market volatility can increase the likelihood of false breakouts, while strong investor sentiment can validate the pattern.