Did you know that diamond pattern trading can be a highly effective strategy for identifying potential trend reversals in the financial markets? With its distinct shape resembling a diamond, this pattern is characterized by a series of higher highs and lower lows, indicating a period of consolidation before a possible breakout.
In this article, we will explore the key characteristics and strategies associated with diamond pattern trading. By understanding how to identify and analyze these patterns on price charts, you can gain valuable insights into market dynamics and make more informed trading decisions.
Using an analytical approach, we will delve into the process of developing a trading strategy based on the diamond pattern. From setting entry and exit points to managing risk, we will provide practical tips to help you execute trades effectively.
To enhance your understanding, we will also include real-life case studies and examples showcasing successful trades using the diamond pattern. So whether you are an experienced trader or just starting out, join us as we unravel the secrets behind diamond pattern trading for profitable outcomes in the financial markets.
Key Takeaways About Diamond Pattern Trading
- Diamond pattern trading is a strategy used to identify trend reversals in financial markets.
- Diamond patterns are characterized by higher highs and lower lows, indicating consolidation before a possible breakout.
- Traders analyze diamond patterns on price charts to make informed trading decisions.
- Different variations of diamond patterns offer insights into potential price reversals or continuations.
Understanding the Diamond Pattern
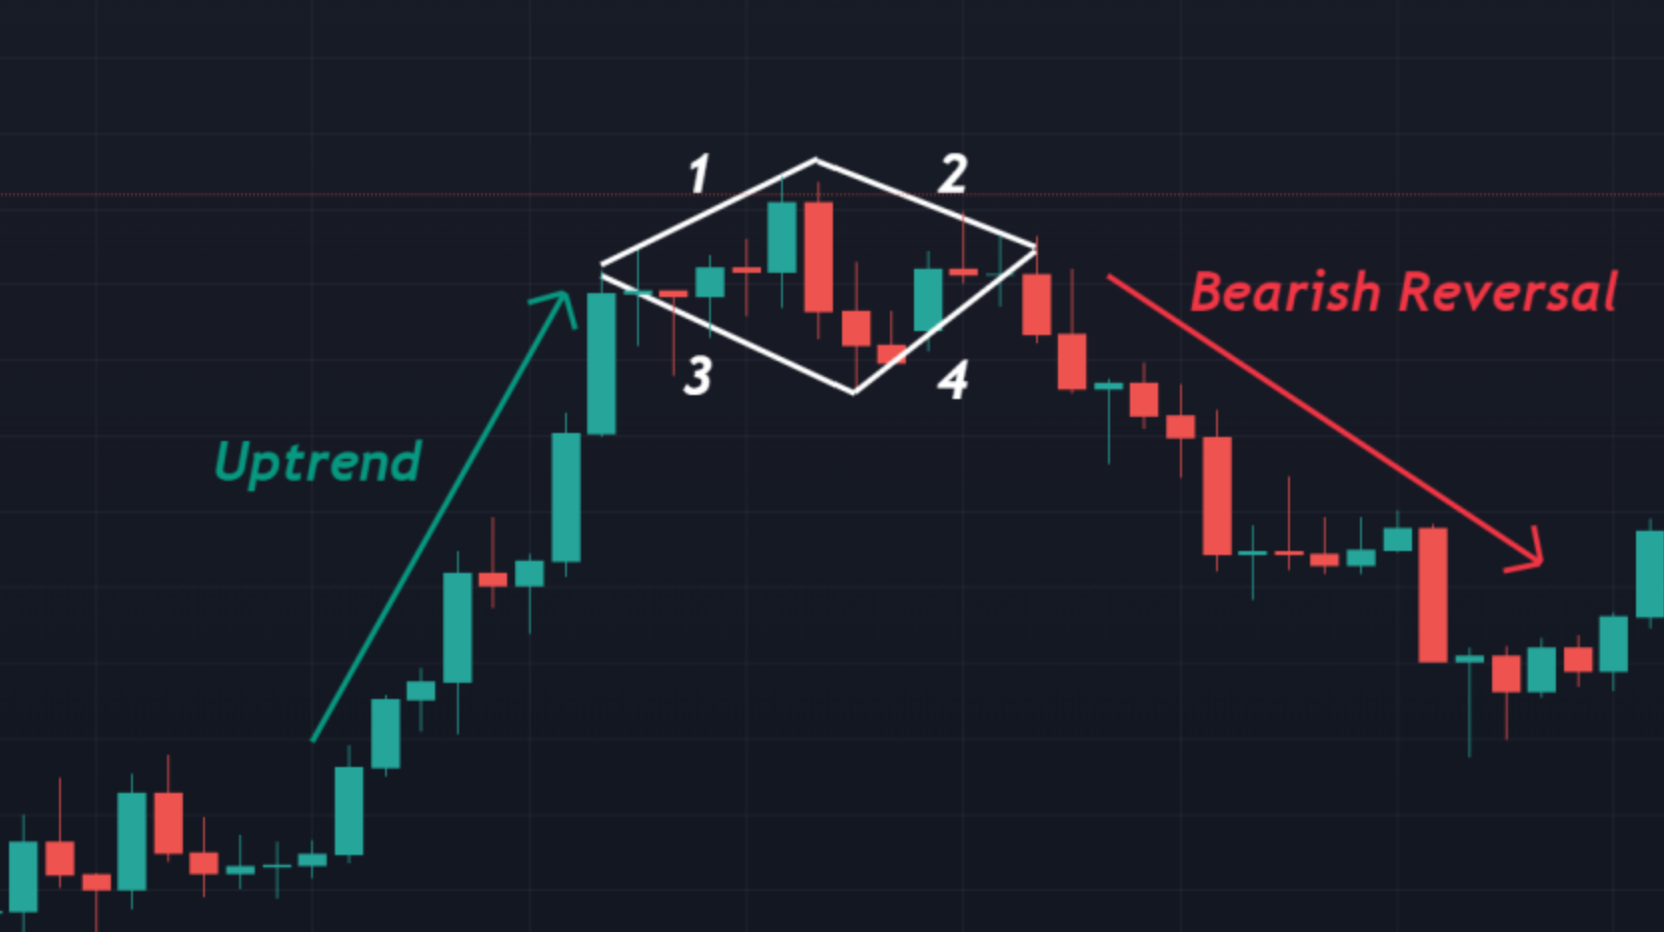
To fully grasp the intricacies of the diamond pattern, you’ll need to delve into its various components and understand how they interact with each other. The diamond pattern formation is a technical analysis chart pattern that occurs when there is a consolidation phase in price movement, resulting in a symmetrical shape resembling a diamond. This pattern usually indicates an impending breakout, as it suggests that market participants are undecided about the direction of the asset’s price.
Traders closely monitor the diamond pattern breakout, which occurs when price breaks out of the boundaries of the formation. A breakout above the upper boundary signals a bullish move, while a breakout below the lower boundary indicates a bearish move. Understanding these key characteristics can help traders identify potential entry and exit points based on this unique chart formation.\
credits: olyptrade
Identifying Diamond Patterns in Charts
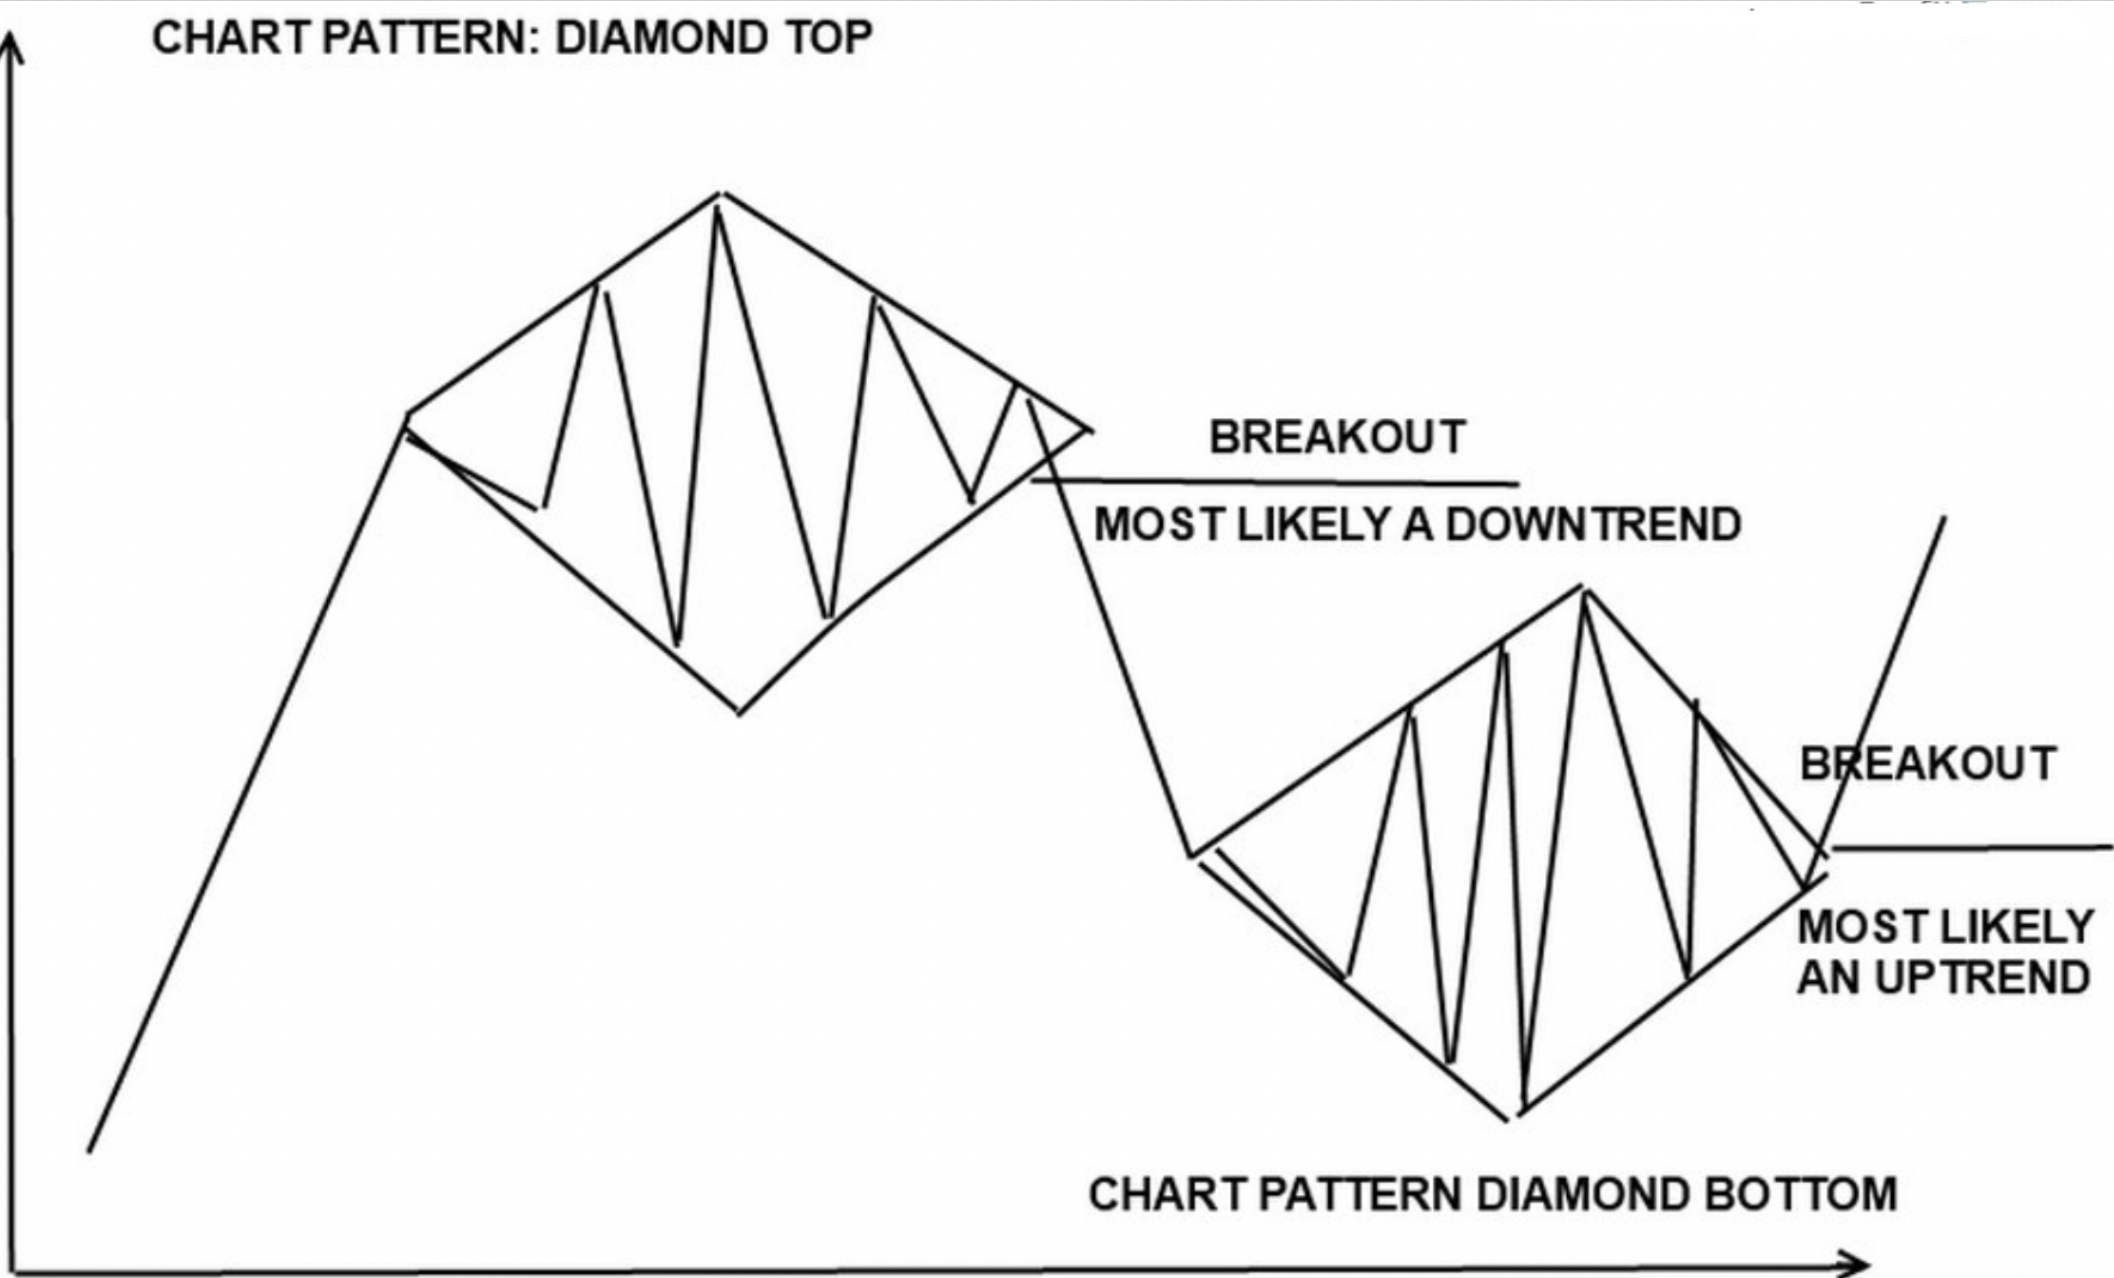
To spot diamond patterns in charts, you need to look for a series of higher highs and lower lows that form a symmetrical shape. Common variations of diamond patterns include the ascending triangle and descending triangle formations. By identifying these patterns, you can gain insight into potential market reversals or continuation trends.
How to Spot Diamond Patterns
Spotting diamond patterns is like finding a hidden treasure chest filled with endless possibilities that will make your heart skip a beat. To identify diamond patterns in charts, you need to look for specific characteristics. Firstly, the pattern consists of two converging trend lines forming a shape resembling a diamond. The upper trend line connects lower highs, while the lower trend line connects higher lows. This symmetrical shape indicates potential price consolidation before a breakout occurs.
Secondly, trading strategies for diamond patterns involve waiting for the price to break out of the pattern’s boundaries. Traders often place buy orders above the upper trend line and sell orders below the lower trend line to capitalize on potential price movements. Additionally, it is essential to monitor volume levels during this pattern as increased volume can confirm the validity of the breakout. Understanding how to spot and trade diamond patterns can provide traders with valuable insights into market trends and help them make informed trading decisions.
Common Variations and Formations
One of the most fascinating aspects of diamond patterns is the wide range of variations and formations that can occur, each offering unique insights into market dynamics. Diamond pattern formations can take on different shapes and sizes, providing traders with valuable information about potential price reversals or continuations. Here are some common variations and formations to be aware of:
- Symmetrical Diamond: This formation is characterized by converging trend lines that create a symmetrical shape resembling a diamond. It suggests indecision in the market and can indicate a potential breakout in either direction.
- Ascending Diamond: In this formation, the upper trend line slopes upward while the lower trend line remains horizontal. It often signals a bullish continuation pattern, indicating an uptrend may resume.
- Descending Diamond: The opposite of an ascending diamond, this formation features a downward sloping upper trend line and a horizontal lower trend line. It typically indicates a bearish continuation pattern, suggesting that a downtrend may continue.
- Expanded Diamond: This variation occurs when the price volatility increases within the diamond pattern, resulting in wider swings between highs and lows. It can signal increased trading opportunities in diamond patterns.
Understanding these various formations can provide traders with valuable insights into potential trading opportunities in diamond patterns. By recognizing these patterns and their implications, traders can make more informed decisions when entering or exiting trades.
Analyzing the Diamond Pattern
Explore the mesmerizing intricacies of the Diamond Pattern and let it captivate your trading instincts. When analyzing pattern formation, it is crucial to interpret price movements accurately. The Diamond Pattern consists of two converging trendlines that create a diamond-shaped formation on the chart. This pattern typically indicates a period of consolidation before a potential breakout or breakdown occurs.
To analyze this pattern effectively, pay attention to the length and angle of the trendlines as well as the volume during its formation. A break above or below the trendlines confirms a potential bullish or bearish move, respectively. Additionally, traders should consider other technical indicators like moving averages or oscillators for confirmation signals. Remember that accurate interpretation of price movements within the Diamond Pattern can help you make informed trading decisions and maximize your profits in this captivating market phenomenon.
Developing a Trading Strategy
Discover the dynamic dance of decision-making in developing your own profitable trading plan. To create a successful trading strategy, it is crucial to backtest it thoroughly. This involves analyzing historical data and simulating trades to determine its effectiveness. By doing so, you can identify potential flaws or weaknesses in your strategy and make necessary adjustments before risking real capital.
In addition to backtesting, effective risk management is essential in trading. It involves setting specific parameters for position sizing, stop-loss levels, and profit targets. By implementing a solid risk management plan, you can protect your capital and minimize potential losses.
To further enhance your trading strategy, consider incorporating these three sub-lists:
- Set clear entry and exit rules based on technical indicators or price action patterns.
- Utilize trailing stops to protect profits while allowing room for potential gains.
- Regularly review and analyze your trades to identify areas for improvement.
By following these guidelines and continuously refining your approach through backtesting and risk management techniques, you can increase the likelihood of success in diamond pattern trading.
Executing Trades with the Diamond Pattern
To effectively execute trades using the diamond pattern, you must master the art of timing your entry and exit points with precision. This is crucial for maximizing profits and minimizing losses. When trading with the diamond pattern, it is important to identify key support and resistance levels within the pattern. These levels act as potential entry and exit points for trades.
By waiting for price to touch these levels before executing a trade, you increase the likelihood of entering at a favorable price and reducing the risk of false breakouts. Additionally, implementing proper risk management techniques is essential when executing trades with the diamond pattern. This includes setting stop-loss orders to limit potential losses and employing position sizing strategies to protect your capital. By incorporating these elements into your trading strategy, you can increase your chances of executing profitable trades using the diamond pattern.
Case Studies and Examples
Let’s take a look at some real-life examples and see how traders have successfully applied the diamond pattern to make profitable trades while minimizing risk.
- Case Study 1: Trader A identified a diamond pattern forming in the stock chart of Company X. They waited for the breakout above the upper trendline before entering a long position. The trade resulted in a 20% profit within two weeks.
- Case Study 2: Trader B spotted a diamond pattern in the cryptocurrency market. They patiently waited for the price to break below the lower trendline before shorting the asset. This strategy allowed them to gain a 15% profit in just one week.
- Case Study 3: Trader C noticed a diamond pattern forming in an index fund’s chart. They used this setup as an opportunity to buy call options, predicting an upward movement. The trade resulted in a 30% return on investment within a month.
- Case Study 4: Trader D observed multiple diamond patterns across different sectors of the stock market. By diversifying their trades, they managed to achieve consistent profits over time, leveraging this reliable pattern.
These case studies showcase how traders have effectively applied the diamond pattern strategy to make profitable trades, highlighting its versatility and effectiveness in various markets and assets.
Frequently Asked Questions
Are diamond patterns only found in specific markets or can they appear in any financial instrument?
Diamond patterns can appear in any financial instrument, providing trading opportunities across various markets. This versatility is one of the advantages of diamond pattern trading, allowing traders to capitalize on price movements in different assets.
How long does it typically take for a diamond pattern to form and complete?
On average, diamond patterns can take anywhere from a few weeks to several months to form and complete. The duration varies across different markets due to factors such as market volatility, trading volume, and investor sentiment.
What are some common indicators or tools used to confirm the validity of a diamond pattern?
To confirm the validity of a diamond pattern, traders commonly use indicators such as moving averages, volume analysis, and trendlines. These tools help assess market trends and validate the formation of diamond patterns. Trading strategies for diamond patterns involve identifying entry and exit points based on these indicators.
Can the diamond pattern be used for both bullish and bearish trading strategies?
Yes, the diamond pattern can be used for both bullish and bearish trading strategies. It is particularly effective in volatile markets. Economic factors play a significant role in shaping diamond pattern trading strategies.
Are there any specific risk management techniques to consider when trading with the diamond pattern?
When trading with the diamond pattern, it’s important to consider specific risk management techniques to protect your investments. These techniques can help mitigate potential drawbacks and ensure a more secure trading experience.