In the realm of technical analysis, the financial markets offer a plethora of patterns that can provide valuable insights into potential price reversals. One such pattern is the tweezer bottom candlestick pattern. This pattern, akin to a needle in a haystack, emerges at the end of a bearish trend and comprises two candles. The first candle is bearish, while the second is bullish, and both candles have lows at the same or nearly the same level. The significance of this pattern lies in its indication of a possible shift from a downtrend to an uptrend, suggesting a weakening of selling pressure and an upsurge in buying pressure.
However, caution is warranted, and additional indicators should be consulted for confirmation. To initiate a long position, traders typically wait for the higher high of the previous two candles to be breached. Risk management is crucial, with stop loss levels set just below the low of the tweezer lows. Ultimately, traders may consider taking profit at the nearest market structure or resistance level. By incorporating the tweezer bottom pattern into their trading strategies, investors can potentially capitalize on market reversals while considering market conditions and employing complementary technical analysis methods.
Key Takeaways
- Tweezer Bottom is a reversal candlestick pattern signaling a potential change in price direction.
- The pattern occurs at the end of a bearish trend and consists of two candles.
- It indicates a bullish trend reversal.
- Traders should be cautious when they observe tweezer top or tweezer bottom patterns and seek confirmation from other indicators.
What is Tweezer Bottom Candlestick Pattern?
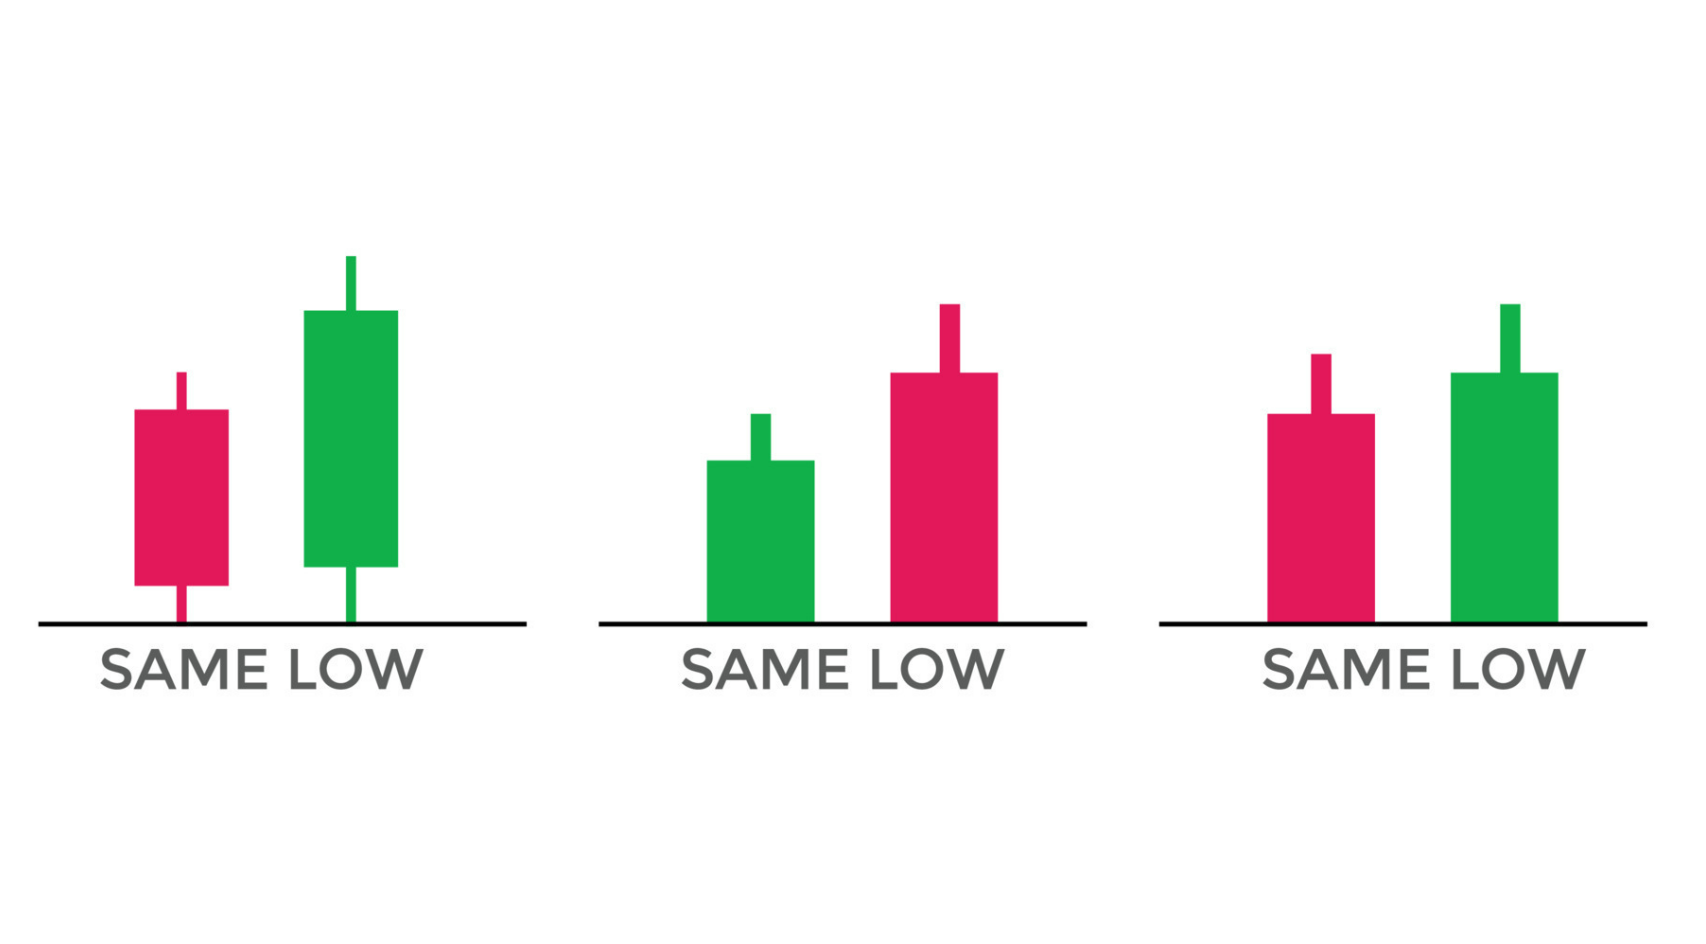
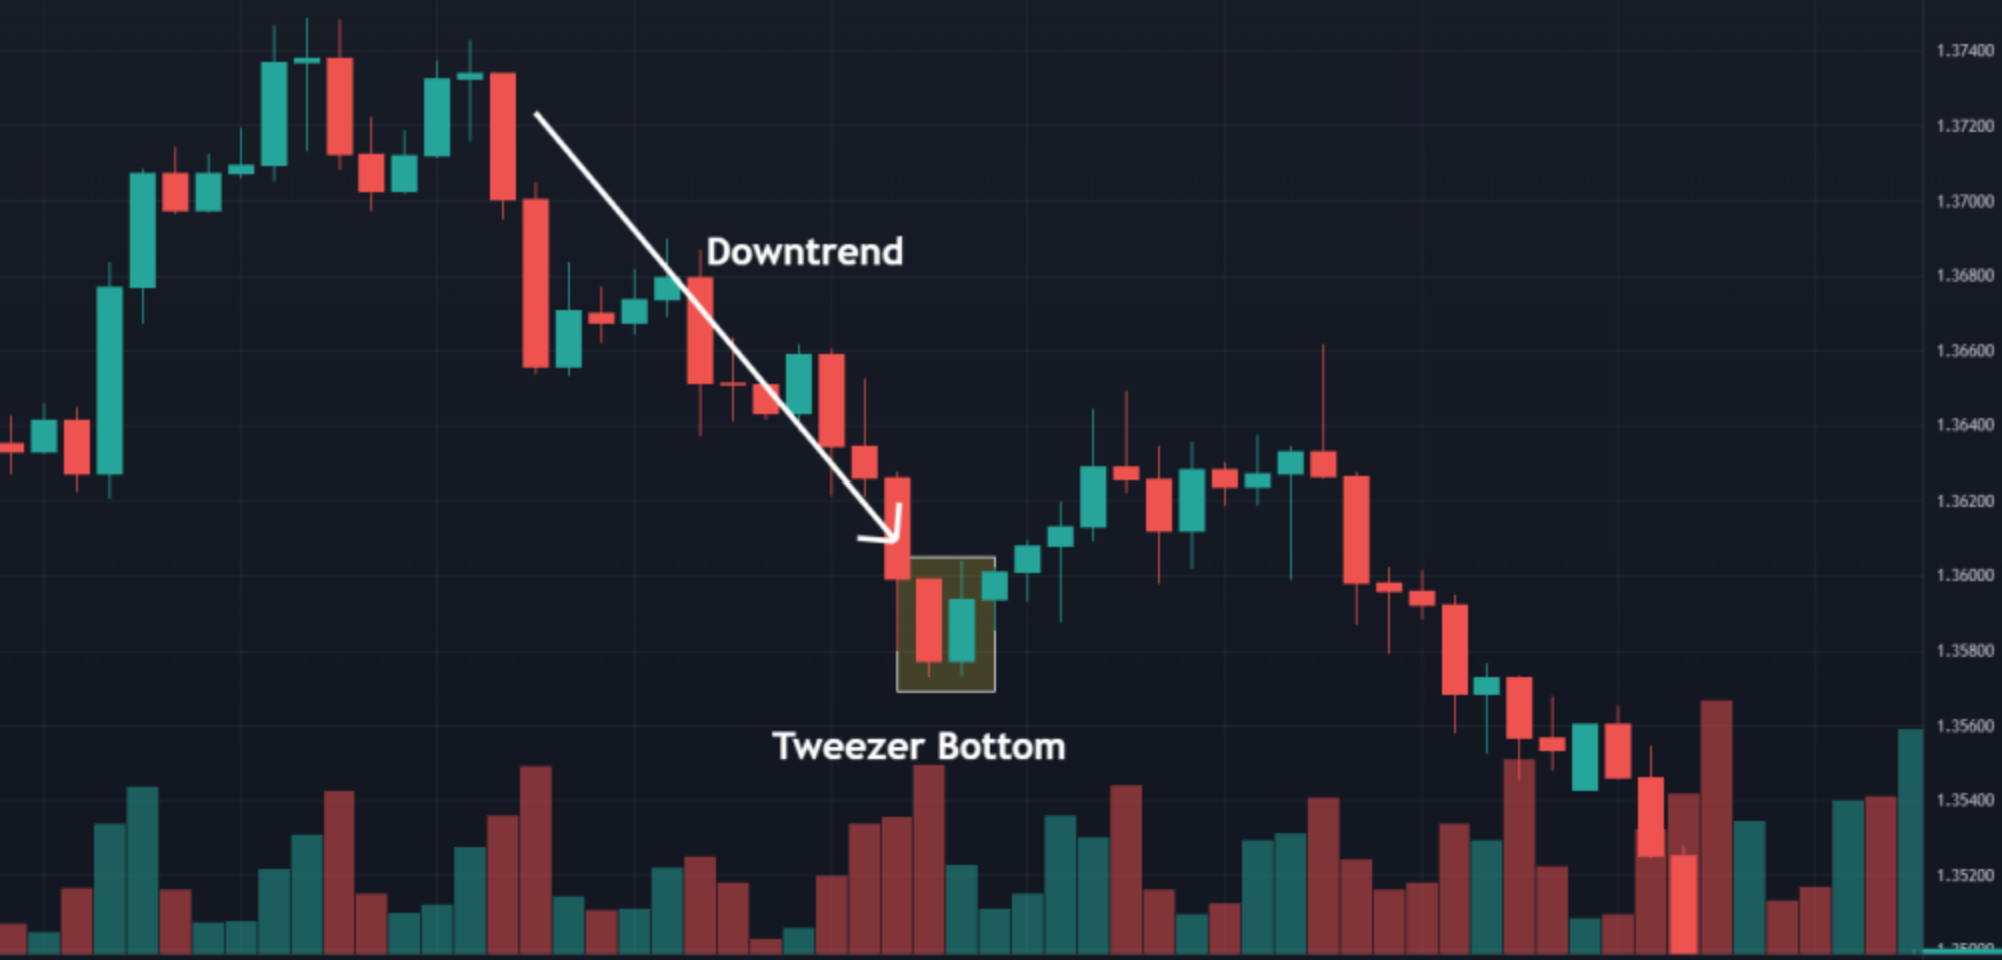
The tweezer bottom candlestick pattern is a reversal pattern that occurs at the end of a bearish trend and consists of two candles with the same or nearly the same low, suggesting a potential change in price direction from a downtrend to an uptrend. This pattern holds significant importance and significance in technical analysis as it indicates a possible trend reversal and provides traders with an opportunity to enter into a bullish position.
Many successful trades have been executed using the tweezer bottom pattern, with traders utilizing it as a signal to initiate long positions. Various examples and case studies have showcased the effectiveness of this pattern in predicting market reversals and generating profitable trades. Traders often combine the tweezer bottom pattern with other technical indicators and volume analysis to increase the reliability of their trading decisions.
Formation and Structure of Tweezer Bottom Pattern
During the formation of this reversal pattern, two consecutive candlesticks with equal or nearly equal lows emerge, resembling two sturdy pillars supporting a structure, hinting at a potential shift from a downtrend to an uptrend. The formation and structure of the tweezer bottom candlestick pattern play a crucial role in identifying potential reversal zones in the market.
Traders should not solely rely on the pattern itself but also consider the importance of volume confirmation. High trading volume during the formation of the pattern strengthens the reliability of the reversal signal. Additionally, identifying potential reversal zones, such as significant support levels or the end of a prolonged downtrend, can enhance the accuracy of the pattern. By incorporating these factors, traders can make more informed decisions and increase the likelihood of successful trades.
Tweezer Bottom Candlestick: Confirmation and Entry
Confirmation and entry for the tweezer bottom reversal pattern can be determined by considering additional technical indicators and analyzing the overall market conditions. Traders should not solely rely on the tweezer bottom pattern for making trading decisions, but should also look for confirmation from other indicators such as volume, trend confirmation, and market structure. It is important to note that the reliability of the pattern may vary depending on the market and timeframe being analyzed.
To further illustrate this point, the following table provides a comparison of the reliability of the tweezer bottom pattern on different timeframes:
| Timeframe | Reliability |
|---|---|
| Daily | High |
| 4-hour | Medium |
| 1-hour | Low |
| 15-minute | Very Low |
| 5-minute | Not Reliable |
Traders should use the confirmation from these additional indicators to increase the probability of a successful trade entry. It is recommended to wait for a clear signal from these indicators before entering a trade based on the tweezer bottom pattern.
Tweezer Bottom: Risk Management
Risk management is a crucial aspect of trading as it helps to mitigate potential losses and protect one’s capital. When it comes to the tweezer bottom candlestick pattern, implementing effective risk management strategies is essential. Here are two important considerations for risk management in trading the tweezer bottom pattern:
- Position sizing: Traders should carefully determine the appropriate position size for their trades based on their risk tolerance and account size. This involves calculating the maximum amount of capital that can be risked per trade, taking into account the stop loss level and the potential reward-to-risk ratio.
- Stop loss placement: Placing a stop loss order is crucial to limit potential losses in case the trade goes against expectations. With the tweezer bottom pattern, a common approach is to set the stop loss just below the low of the tweezer lows. This level serves as a point where the pattern would be invalidated, indicating that the market sentiment has shifted.
By implementing proper position sizing and setting an appropriate stop loss, traders can effectively manage their risk when trading the tweezer bottom candlestick pattern.
Trading Strategies Using Tweezer Bottom Pattern
One effective approach to trading the tweezer bottom pattern is to combine it with other technical indicators to confirm the potential reversal and increase the probability of a successful trade. By incorporating additional technical confirmation methods, traders can enhance their analysis and make more informed trading decisions.
The tweezer bottom pattern can be used in different markets, such as stocks, forex, and commodities, to identify potential reversals in price direction. Additionally, traders can implement the tweezer bottom pattern in a trading algorithm to automate the identification and execution of trades based on this pattern. This can help traders take advantage of the pattern’s reliability and ease of use, while also reducing the impact of emotions on their trading decisions.
Frequently Asked Questions
How often does the tweezer bottom pattern appear in the forex market?
The frequency of the tweezer bottom pattern in the forex market is not specifically documented. However, frequency analysis of other candlestick patterns suggests that they occur relatively frequently, indicating that the tweezer bottom pattern may also appear frequently. When compared to other reversal patterns in forex trading, the tweezer bottom pattern is considered reliable and easy to follow.
What are some additional technical confirmation methods that can be used to identify the tweezer bottom pattern?
Volume confirmation and trendline confirmation are two additional technical confirmation methods that can be used to identify the tweezer bottom pattern. These methods provide further validation of the pattern and enhance the reliability of the potential bullish reversal signal.
How can traders manually enter a trade based on the tweezer bottom pattern?
Traders can manually enter a trade based on the tweezer bottom pattern by initiating a long position when the higher high of the previous two candles is crossed. This trade entry strategy is effective in identifying and trading the tweezer bottom pattern.
Where should the stop loss be placed when trading the tweezer bottom pattern?
The optimal risk management strategy for trading tweezer bottom patterns includes placing the stop loss 2 pips below the low of the tweezer lows. Volume analysis plays a crucial role in confirming the validity of tweezer bottom patterns.
What are some other factors that should be considered before confirming a reversal based on the tweezer bottom pattern?
Factors affecting reversal confirmation in the tweezer bottom pattern include volume, trend confirmation, and overall market conditions. Common mistakes when identifying the pattern include not considering these factors and relying solely on the candlestick pattern itself.