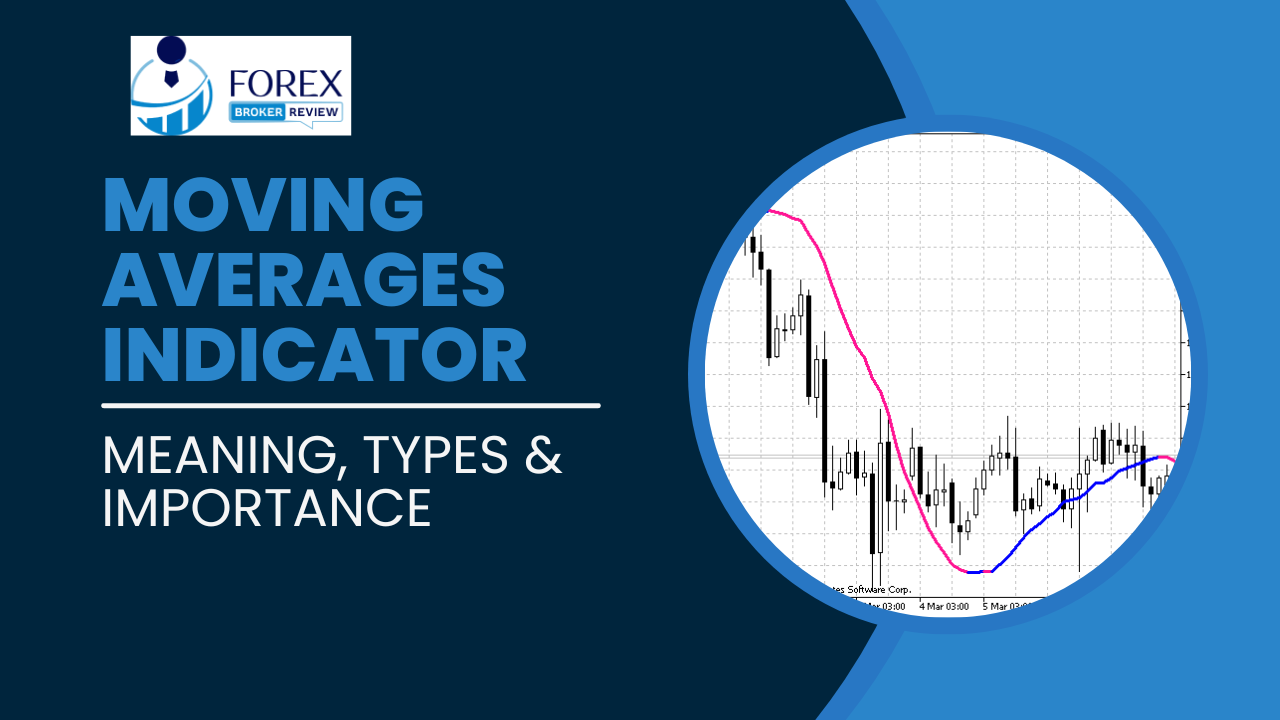
Moving averages indicator: Where past data meets trend identification. As the saying goes, ‘History repeats itself.’ In the world of technical analysis, this adage holds true in the form of the moving averages indicator. This upgraded version of the traditional moving average indicator offers a streamlined approach to determining trend direction, without overcrowding the chart.
By utilizing the same calculation as the moving average, this indicator assists traders in identifying market trends and potential changes in direction. Furthermore, it can be employed to pinpoint potential support and resistance levels. While it can be applied to all timeframes, longer timeframes are recommended for trend identification.
When coupled with a crossover strategy, where a shorter-term moving average crosses above or below the longer-term one, this indicator can serve as a buy or sell signal. However, it is important to note that signal confirmation from other forms of technical analysis is crucial. Despite its versatility, the moving averages indicator should be used with caution, as it relies solely on past data and may be prone to false signals. In this article, we will explore the calculation and purpose of this indicator, as well as the pros and cons associated with its use.”
Key Takeaways
- Moving Averages is an upgraded version of the traditional Moving Average indicator used to determine trend direction.
- It is easy to use and doesn’t overpopulate the chart.
- The indicator can be used for a crossover strategy, where shorter-term moving averages crossing above longer-term moving averages is a buy signal, and vice versa.
- Moving Averages work on all timeframes, but it’s better to look for trends on a longer timeframe.
What is Moving Averages Indicator?
The Moving Averages indicator is a modified version of the traditional Moving Average indicator, commonly used in technical analysis to identify trend direction and potential changes in market direction. It is an upgraded version that helps traders effectively determine trend direction and make informed trading decisions. To use Moving Averages effectively, traders should look for the price to go above the indicator for a buy signal and below the indicator for a sell signal.
It can also be used to identify potential support and resistance levels. In different trading strategies, Moving Averages can be used for a crossover strategy, where the shorter-term Moving Averages crossing above the longer-term indicates a buy signal, and vice versa for a sell signal. Traders can also use other forms of technical analysis for signal confirmation. Overall, Moving Averages provide traders with a reliable tool to understand trend direction and make profitable trading decisions.
Moving Averages Indicator: Calculation and Purpose
One cannot deny the allure of a mathematical formula that calculates and serves a purpose, guiding investors and traders alike in their quest for profitable market decisions. The calculation of Moving Averages (CMA) is based on the same principles as the traditional Moving Average (MA) indicator. It involves summing up a specified number of previous price values and dividing them by the number of periods considered.
The purpose of using Moving Averages is to identify and analyze market trends. By plotting the CMA on a chart, traders can observe the direction of the market and potential changes in trend. When the price goes above the CMA, it indicates an uptrend, while going below the CMA indicates a downtrend. Additionally, the CMA can be used to identify potential support and resistance levels. Overall, the calculation and application of Moving Averages play a crucial role in trend analysis.
Moving Averages: Signal Confirmation
Signal confirmation can be achieved through the use of other technical analysis tools. While the Moving Averages indicator can provide valuable insights into market trends, it is important to verify its signals through additional analysis. Traders can employ various methods to confirm the signals generated by the indicator. One common approach is to use oscillators, such as the Relative Strength Index (RSI) or the Moving Average Convergence Divergence (MACD), to assess the strength of the trend indicated by the Moving Averages.
Additionally, chart patterns, such as double tops or head and shoulders formations, can be used to confirm the signals. By incorporating these tools, traders can reduce the risk of false signals and enhance the accuracy of their trading decisions. Signal confirmation is crucial as it helps traders make more informed choices and increases the probability of successful trades.
Moving Averages Indicator: Pros and Cons
Pros and cons need to be considered when using the Moving Averages indicator. One of the advantages of this indicator is its simplicity and ease of understanding. It can be applied to any timeframe, making it versatile for traders with different trading styles. Additionally, Moving Averages can act as support and resistance levels, helping traders identify potential price reversal points.
Another benefit is the customizable period, allowing traders to adjust the indicator according to their trading preferences. However, there are also drawbacks to using Moving Averages. Since it relies solely on past data, it may generate false signals, leading to potential losses. Traders should be cautious and use additional forms of technical analysis for signal confirmation. Despite these limitations, Moving Averages remain a useful tool for identifying trend direction and can be integrated into various trading strategies.
Frequently Asked Questions
How can Moving Averages be customized to suit individual trading strategies?
Moving averages can be customized to suit individual trading strategies by adjusting the period lengths and using different price inputs. Traders can also incorporate other technical indicators for signal confirmation and backtest their moving averages crossover strategies.
Can Moving Averages be used in conjunction with other technical indicators?
Yes, moving averages can be used in conjunction with other technical indicators. They can be compared to standard moving averages to identify differences in trend direction and provide additional confirmation. The advantages of using moving averages include their ability to be tailored to individual trading strategies and their potential to act as support and resistance levels.
Are there any specific timeframes that Moving Averages work best on?
The optimal settings for using Moving Averages depend on the trader’s specific goals and trading strategy. However, longer timeframes are generally considered best for identifying trends and minimizing false signals.
How can traders effectively use Moving Averages to identify potential support and resistance levels?
Traders can effectively use moving averages to identify potential support and resistance levels by applying them in trend following strategies. They can also utilize moving averages for dynamic stop loss placement to manage risk.
What are some common strategies that traders use with Moving Averages?
Some common strategies that traders use with moving averages include moving averages crossover and weighted moving averages. These strategies involve using the intersection of shorter-term and longer-term moving averages to generate buy and sell signals.