In the world of technical analysis, identifying patterns that can predict market reversals is of utmost importance for traders. One such pattern that has gained significant attention is the Three Black Crows candlestick pattern.
This bearish reversal pattern signifies the end of an uptrend and is characterized by three consecutive long-bodied candlesticks that open within the previous candle and close lower than the previous candle.
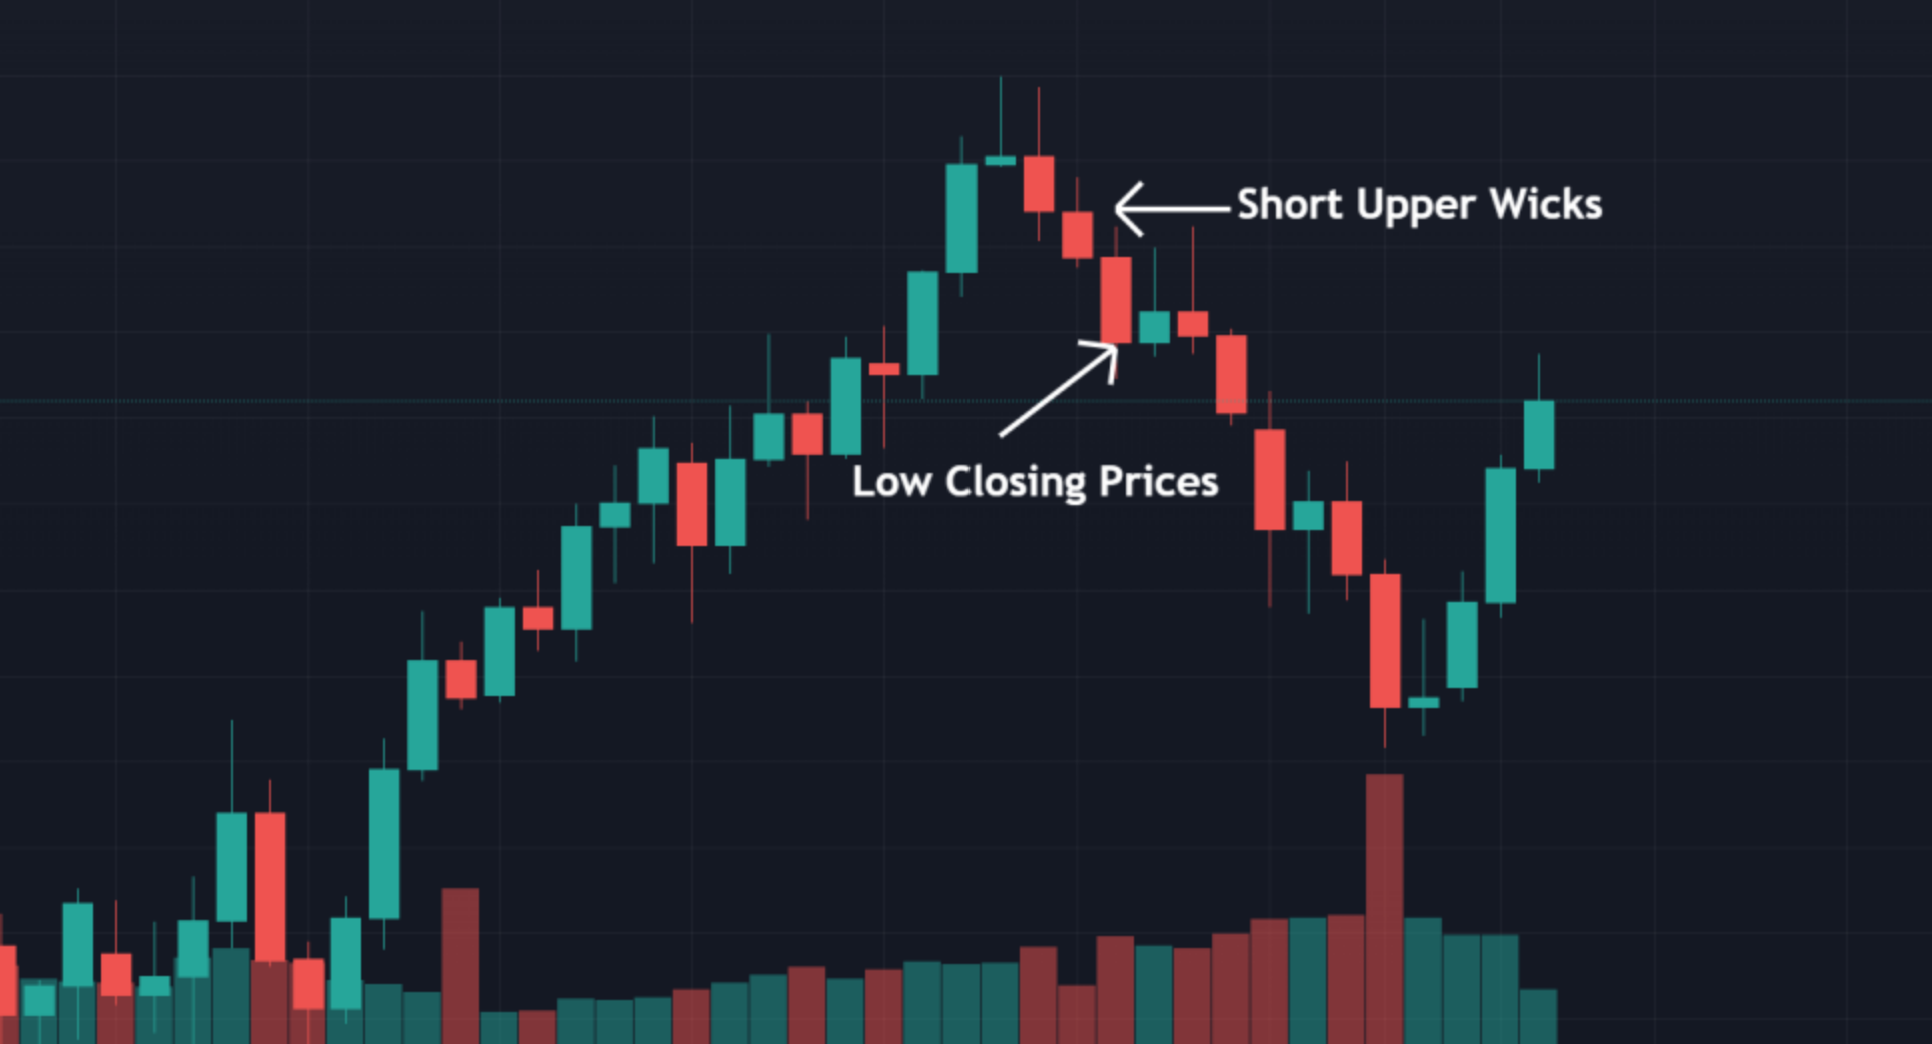
The pattern’s key characteristics include long real bodies, short or nonexistent shadows, and relatively high volume during the three-day formation. These elements indicate a strong bearish sentiment and the dominance of a larger group of bears over a small group of bulls.
When used alongside other technical indicators and chart patterns, the Three Black Crows pattern can provide traders with a confirmation of the reversal and assist in developing successful trade or exit strategies. However, it is crucial to exercise caution and consider market conditions and other indicators to avoid falling into oversold territory.
By understanding the intricacies of the Three Black Crows candlestick pattern and incorporating it into their analysis, traders can enhance their ability to identify and capitalize on reversing trends in the financial markets.
Key Takeaways
- Three black crows is a bearish candlestick pattern that indicates a reversal of an uptrend.
- The pattern consists of three consecutive long-bodied candlesticks that open within the previous candle and close lower than the previous candle.
- Traders should use this pattern alongside other technical indicators or chart patterns for confirmation.
- The size of the candles and the presence of shadows can provide insights into the risk of a retracement.
What is Three Black Crows Candlestick Pattern?
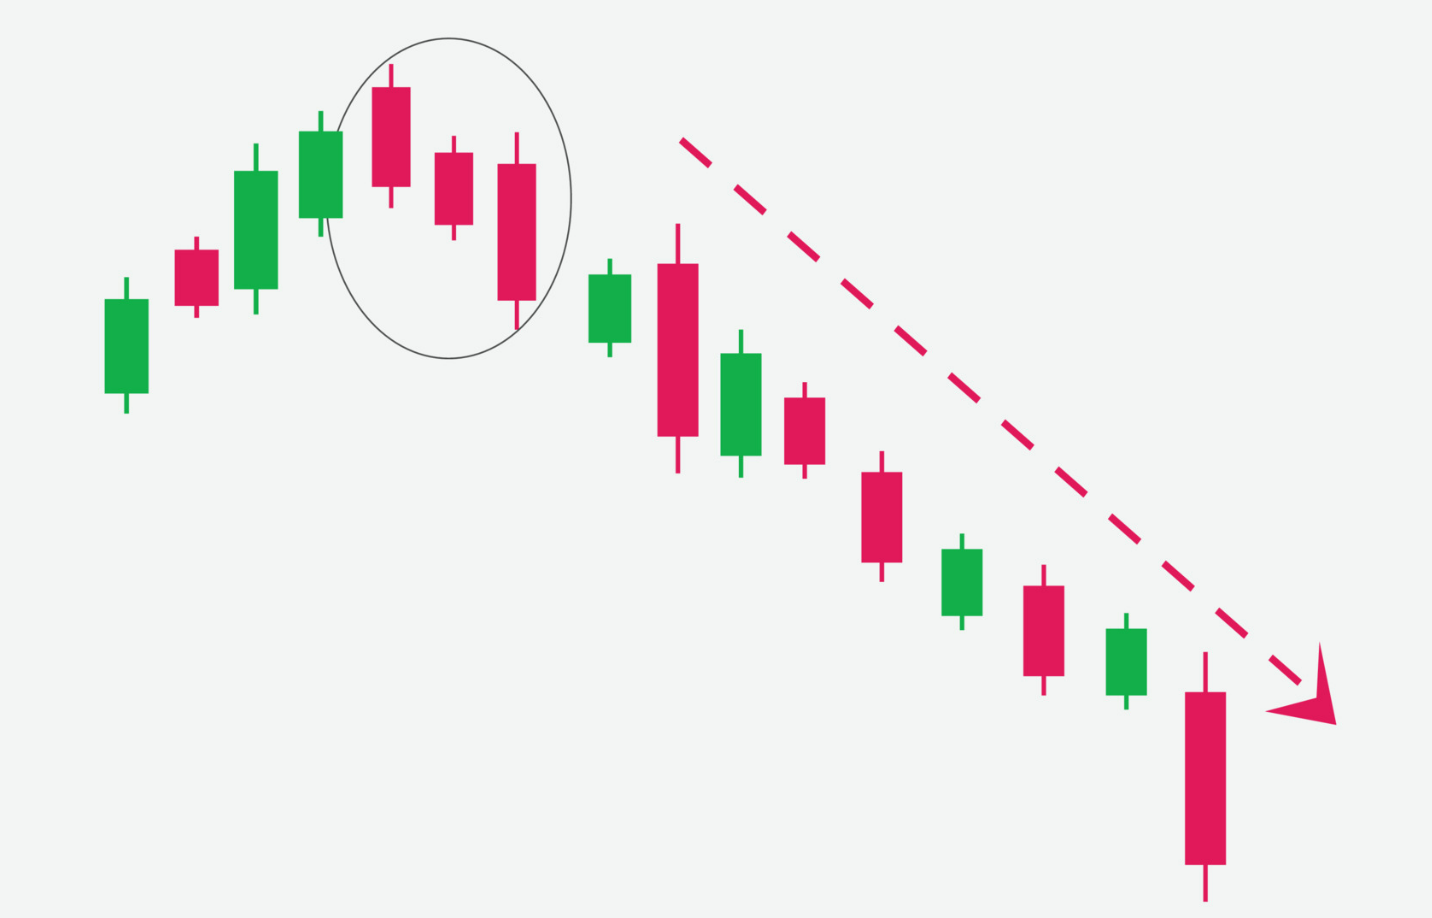
The three black crows pattern is a bearish candlestick pattern consisting of three consecutive long-bodied candlesticks that open within the previous candle and close lower than the previous candle, indicating a reversal of an uptrend.
This pattern is known as a visual pattern that occurs when bears dominate three consecutive trading sessions. It is characterized by bearish long-bodied candlesticks with short or no shadows. The price opens higher than the previous close but is pushed lower throughout the session, closing near the session low. Traders interpret this pattern as the start of a bearish downtrend.
It is important to note that the pattern should have long, real bodies and short or nonexistent shadows. Additionally, volume during the uptrend should be low, while the three-day black crow pattern should have relatively high volume.
The three black crows pattern requires confirmation from other indicators and volume analysis to be considered reliable.
Three Black Crows Pattern Characteristics
Characteristics of the pattern include three consecutive long-bodied candlesticks that open within the previous candle and close lower than the previous candle. This bearish pattern is visually represented by the three black crows, which have short or nonexistent shadows. The price opens higher than the previous close but is pushed lower throughout the session, closing near the session low. Traders interpret this as the start of a bearish downtrend. Table below provides a summary of the key characteristics of the three black crows pattern.
| Characteristic | Description |
|---|---|
| Candlestick Type | Long-bodied |
| Candlestick Color | Black |
| Shadows | Short or nonexistent |
| Opening Price | Higher than previous close |
| Closing Price | Lower than previous close |
Identifying signals of the three black crows pattern include a steep upward trend prior to the pattern formation, low wicks, and the longest candle being the third day. Historical examples of the pattern can be observed on the GBP/USD weekly price chart in May 2018, indicating a continuing downturn.
Using the Three Black Crows Candle Pattern
To effectively utilize the three black crows pattern, traders should consider its occurrence alongside other technical indicators and chart patterns for confirmation, as relying solely on this pattern may not provide sufficient information for making trading decisions.
Analyzing candlestick patterns is an essential aspect of technical analysis, and the three black crows pattern can be a valuable tool in identifying potential reversals in an uptrend. However, it is crucial to incorporate other indicators to confirm the pattern’s validity and assess the overall market conditions.
Traders can develop trading strategies with the three black crows pattern by combining it with other patterns or indicators to increase the probability of successful trades. By considering factors such as volume analysis, the size of the candles, and the presence of shadows, traders can enhance their understanding of the pattern and make more informed trading decisions.
Frequently Asked Questions
Can the three black crows pattern be used on any timeframe or is it more effective on specific timeframes?
The effectiveness of the three black crows pattern may vary on different timeframes. Traders should consider using other indicators and patterns to confirm the signal and avoid false signals. Additionally, it is recommended to assess market conditions and use the pattern as part of a comprehensive trading strategy.
Are there any variations of the three black crows pattern that traders should be aware of?
Variations of the three black crows pattern that traders should be aware of include: variations in the size of the candles and the presence of shadows, variations in volume during the pattern, and variations in the confirmation indicators used. Trading strategies for the three black crows pattern involve using other technical indicators and chart patterns for confirmation, assessing asset conditions with technical indicators, and using the pattern in conjunction with other patterns and indicators for a successful trade or exit strategy.
How long does the three black crows pattern typically last before the reversal of the uptrend occurs?
The timing of the reversal in an uptrend when using the three black crows pattern can vary depending on the timeframe being analyzed. The pattern’s effectiveness may differ on shorter or longer timeframes.
Are there any specific indicators or chart patterns that work well in conjunction with the three black crows pattern for confirmation?
Confirmation indicators and trading strategies can be used in conjunction with the three black crows pattern to validate its significance. Examples include volume analysis, trendlines, moving averages, and other candlestick patterns for additional confirmation signals.
Are there any specific risk management strategies that traders should consider when trading based on the three black crows pattern?
Traders utilizing the three black crows pattern should consider risk management strategies to mitigate potential losses. This can include setting stop-loss orders, diversifying their portfolio, and closely monitoring market conditions to make informed trading decisions.

