The TTM Squeeze Indicator is a powerful tool that can help traders identify potential breakouts in the market. Based on the theory that when volatility decreases, it often precedes a period of increased volatility and price movement, this indicator uses Bollinger Bands and Keltner Channels to visually represent these periods of consolidation and expansion.
By analyzing the relationship between these two indicators, the TTM Squeeze Indicator indicates when a stock or asset is reaching a point of compression, suggesting an imminent breakout. This data-driven approach allows traders to make more informed decisions about their trades, increasing their chances of success.
In this comprehensive guide, we will explore how to use the TTM Squeeze Indicator effectively in your trading strategy. We will discuss different strategies for trading with this indicator, provide tips for maximizing its effectiveness, and showcase real-life examples of its application. Whether you are an experienced trader or just getting started, understanding and utilizing the TTM Squeeze Indicator can greatly enhance your trading outcomes.
Key Takeaways
- The TTM Squeeze Indicator helps traders identify potential breakouts in the market
- It provides valuable information about market conditions and helps identify optimal entry and exit points
- Relying solely on the TTM Squeeze Indicator is a common mistake, and confirmation signals from other indicators or price action should be considered
- Proper risk management, position sizing, and the use of additional confirmation indicators are essential for successful trading.
credits: trendspider.com
Understanding the TTM Squeeze Indicator
Now let’s take a closer look at the TTM Squeeze Indicator and how it works for you. The TTM Squeeze Indicator is a powerful tool that helps traders identify periods of low volatility followed by high volatility in the market. It is based on the concept that when volatility decreases, it often leads to a breakout or significant move in price. By using this indicator, traders can anticipate these potential breakouts and position themselves accordingly.
The benefits of using the TTM Squeeze Indicator are numerous. Firstly, it provides traders with valuable information about market conditions, allowing them to make more informed trading decisions. Secondly, it helps identify optimal entry and exit points by pinpointing periods of consolidation and potential breakouts. Lastly, the TTM Squeeze Indicator can be used on any time frame or asset class, making it versatile for different trading strategies. Overall, understanding and utilizing the ttm squeeze indicator can greatly enhance a trader’s ability to navigate volatile markets effectively.
How to Use the TTM Squeeze Indicator
To effectively utilize this powerful tool, you should familiarize yourself with the mechanics and implementation of the TTM Squeeze Indicator. Here are some common mistakes to avoid when using the indicator:
- Relying solely on the TTM Squeeze Indicator: While it is a valuable tool, it’s important to consider other technical analysis indicators and market factors for a comprehensive view.
- Overlooking confirmation signals: The TTM Squeeze Indicator provides early warning signs, but it’s crucial to wait for confirmation from other indicators or price action before making trading decisions.
- Neglecting proper risk management: Like any indicator, the TTM Squeeze Indicator is not foolproof. Always use appropriate stop-loss orders and manage your risk properly.
As for timeframes, the best ones to use with the TTM Squeeze Indicator are typically shorter timeframes such as 5-minute or 15-minute charts. These timeframes offer more frequent signals and can help capture short-term price movements effectively. However, it’s essential to experiment with different timeframes and find what works best for your trading style and goals.
Strategies for Trading with the TTM Squeeze Indicator
One effective strategy for trading with the TTM Squeeze Indicator is to think of it as a ‘pressure cooker’ for the market, indicating potential explosive price movements just like steam building up inside a cooker before it releases. When using this indicator, traders can look for entry and exit points based on specific patterns that occur when volatility increases after a period of consolidation.
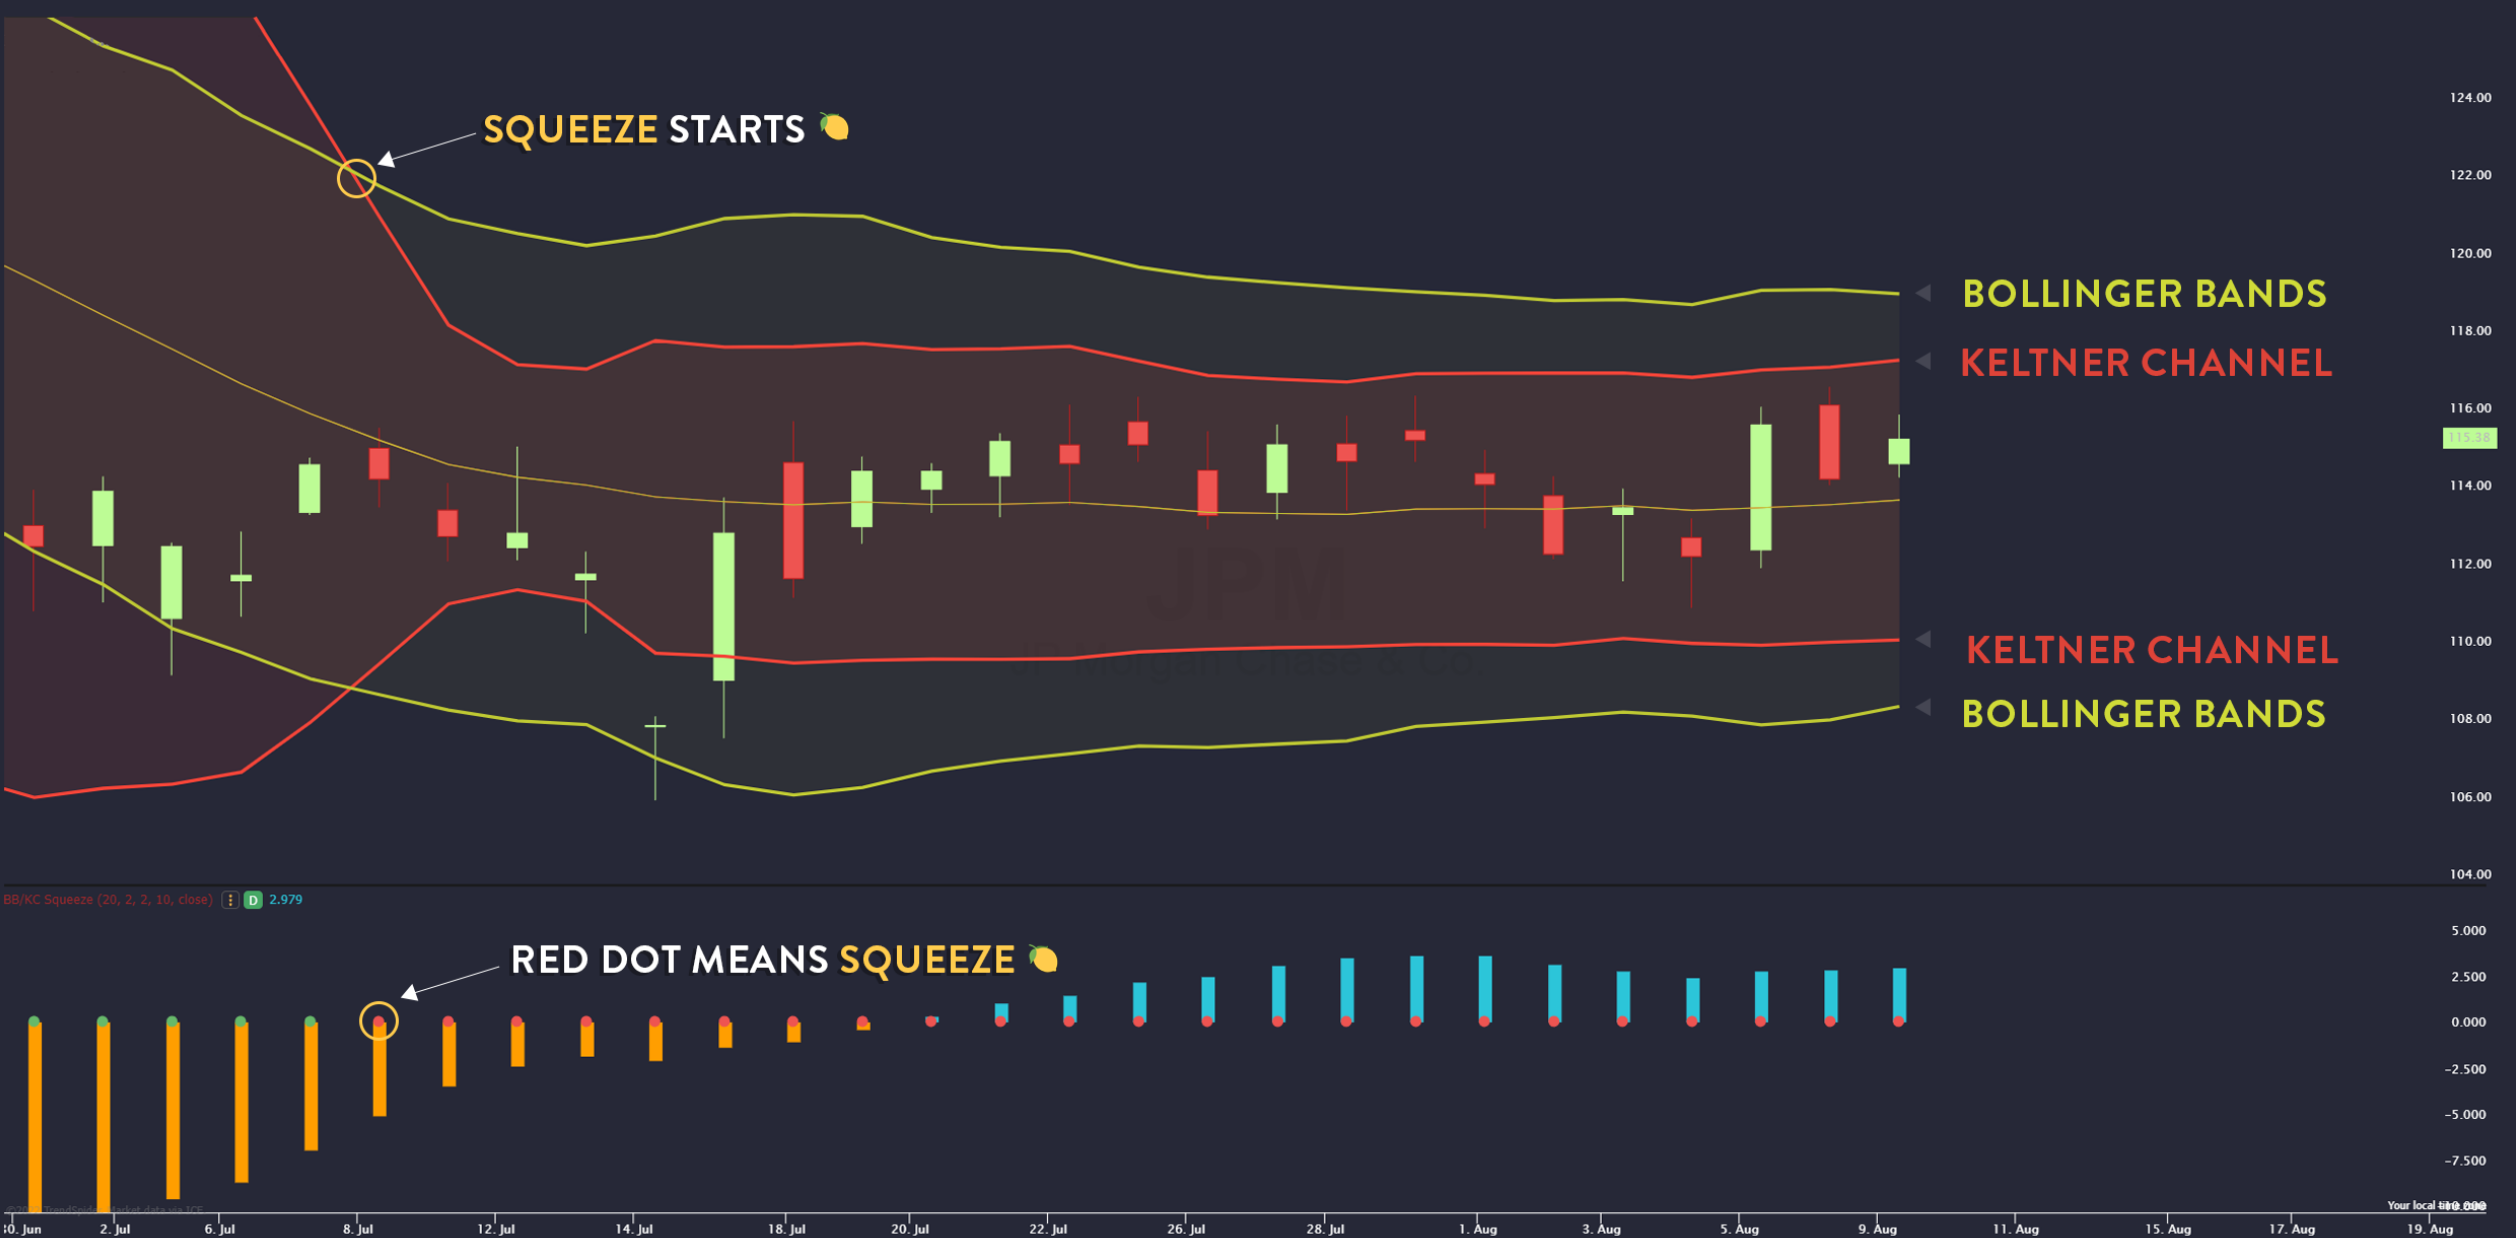
For example, when the Bollinger Bands contract within the Keltner Channels, it suggests low volatility and a potential squeeze. Traders can then wait for a breakout above or below the bands to enter into a trade. Additionally, combining the TTM Squeeze Indicator with other technical analysis tools such as moving averages or trend lines can further enhance trading strategies by providing additional confirmation signals for entry and exit points.
Tips for Maximizing the Effectiveness of the TTM Squeeze Indicator
To maximize the effectiveness of the TTM Squeeze Indicator, it is crucial to set proper stop loss and take profit levels. By doing so, you can protect your capital and minimize potential losses. Additionally, managing risk and position sizing is essential as it helps you maintain a balanced portfolio and avoid overexposure to any single trade. Lastly, avoiding false signals and whipsaws is important to ensure that you are entering trades based on reliable indicators rather than market noise or temporary price fluctuations.
Setting Proper Stop Loss and Take Profit Levels
When setting stop loss and take profit levels for the TTM squeeze indicator, it’s important to visualize your risk and reward potential. Here are three key factors to consider in order to maximize effectiveness:
- Stop Loss: Determine the maximum amount of money you are willing to lose on a trade. This helps manage risk and prevents significant losses if the market moves against you.
- Take Profit Targets: Identify specific price levels where you plan to exit the trade with a profit. This allows you to lock in gains and avoid letting profits turn into losses.
- Risk Management and Position Sizing: Calculate your position size based on your risk tolerance and the distance between your entry point and stop loss level. This helps ensure that each trade aligns with your overall risk management strategy.
By incorporating these elements into your trading plan, along with analyzing false signals, you can enhance the effectiveness of the TTM squeeze indicator and increase your chances of successful trades.
Managing Risk and Position Sizing
Now that you have learned how to set proper stop loss and take profit levels, it’s time to delve into the crucial aspects of risk management and position sizing. Effective risk management is essential for successful trading using the TTM Squeeze indicator. It involves determining the amount of capital you are willing to risk on each trade and setting appropriate position sizes accordingly. By carefully managing your risk, you can protect your trading account from substantial losses and ensure longevity in the market. Position sizing refers to the allocation of capital to individual trades based on their risk-reward profile. It allows you to optimize your returns while keeping your risk within acceptable limits. To help you visualize the importance of these concepts, consider the following table:
| Trade Size | Risk (%) | Potential Reward ® |
|---|---|---|
| Small | 1 | 2R |
| Medium | 2 | 4R |
| Large | 3 | 6R |
By implementing proper risk management and position sizing techniques, you can maximize your chances of success when using the TTM Squeeze indicator.
Avoiding False Signals and Whipsaws
To avoid false signals and whipsaws, you’ll need to stay vigilant and use additional confirmation indicators alongside the TTM Squeeze. While the TTM Squeeze is a powerful tool for identifying potential trend reversals, it is not foolproof. False signals can occur when market conditions are choppy or indecisive, leading to fake breakouts or breakdowns. By incorporating other technical indicators such as moving averages, volume analysis, or support and resistance levels, you can increase the accuracy of your trading strategy. These additional indicators can provide further confirmation of price movements and help filter out false signals. Remember that no indicator is perfect, so it’s essential to use a combination of tools to make informed trading decisions while minimizing the risk of falling victim to false signals and whipsaws.
Real-Life Examples of the TTM Squeeze Indicator in Action
Explore real-life examples of how you can utilize the TTM Squeeze Indicator to enhance your trading strategy.
- The TTM Squeeze Indicator can be used in various trading strategies, such as trend following or mean reversion.
- By analyzing the market using the TTM Squeeze Indicator, traders can identify potential entry and exit points based on volatility contraction and expansion.
- For example, when the Bollinger Bands contract and the Keltner Channels narrow, it indicates a period of low volatility. Traders may consider entering a trade when this squeeze ends and volatility expands.
- Conversely, when the Bollinger Bands expand and the Keltner Channels widen, it suggests increasing volatility. Traders might look for opportunities to exit positions or take profit during such periods.
- By incorporating the TTM Squeeze Indicator into their market analysis, traders can gain valuable insights to optimize their trading decisions.
Conclusion and Final Thoughts on the TTM Squeeze Indicator
Incorporating the TTM Squeeze Indicator into your trading strategy can provide you with valuable insights and enhance your decision-making, ultimately helping you optimize your trades and maximize profits. The effectiveness of the TTM Squeeze Indicator has been demonstrated in real-life applications, as it alerts traders to potential market volatility and breakouts. By identifying periods of low volatility followed by high volatility, this indicator helps traders anticipate significant price movements and take advantage of them. It is important to note that while the TTM Squeeze Indicator is a powerful tool, it should not be used as the sole basis for making trading decisions. It is best utilized alongside other technical analysis tools to confirm signals and improve accuracy. Overall, incorporating the TTM Squeeze Indicator into your trading strategy can significantly enhance your ability to identify profitable opportunities in the market.
| Pros | Cons |
|---|---|
| Identifies volatility | False signals may occur |
| Provides clear entry/exit points | Requires additional confirmation |
| Enhances decision-making | Not suitable for all market conditions |
| Can optimize trades | Requires understanding of technical analysis techniques |
| Maximizes profit potential |
Frequently Asked Questions
What are the most common mistakes traders make when using the TTM Squeeze Indicator?
Traders often make common mistakes when using the TTM Squeeze Indicator. They fail to understand its nuances and rely solely on it for trading decisions. Effective strategies involve combining it with other indicators and analyzing price action to validate signals.
Can the TTM Squeeze Indicator be used for long-term investing or is it primarily for short-term trading?
The TTM Squeeze Indicator can be used for both long-term investing and short-term trading. It provides valuable insights into market volatility and price compression, making it useful for identifying opportunities in any time frame.
Are there any alternative indicators or tools that can be used in conjunction with the TTM Squeeze Indicator?
Alternative indicators can be combined with the TTM squeeze indicator to enhance your analysis. By incorporating tools like Bollinger Bands or the MACD, you can gain a more comprehensive understanding of market conditions and improve your trading decisions.
How does the TTM Squeeze Indicator perform in different market conditions, such as during periods of high volatility or low volatility?
The TTM Squeeze Indicator performs differently in high volatility and low volatility market conditions. In high volatility, the indicator signals potential breakouts or reversals, while in low volatility, it indicates a period of consolidation or a lack of significant price movement.
Are there any specific stocks or markets where the TTM Squeeze Indicator tends to be more effective?
The TTM Squeeze Indicator tends to be more effective in specific stocks and markets. It shows strong performance in different market types, such as high volatility or low volatility, making it a valuable tool for traders.

