In this comprehensive guide, we delve deep into the world of the Stochastic Oscillator, a powerful momentum indicator that has become a staple for traders in the financial markets. Whether you’re a seasoned trader looking to refine your skills or a beginner seeking to understand the nuances of this indicator, this article has got you covered.
Understanding the Stochastic Oscillator
What Is a Stochastic Oscillator?
The Stochastic Oscillator is a technical analysis tool that offers insights into the dynamic changes between a bar’s current closing price and the price extremes over a specified period. Its primary role is to identify various market patterns, including local extremes, trend beginnings and endings, convergence, divergence, and corrections.
George Lane, an American stock analyst, developed the Stochastic Oscillator in 1950. He observed that markets often exhibit oscillatory movements rather than clear trends. Lane’s innovation was based on the major parameters of price bars: closing, high, and low prices.
How Does the Stochastic Oscillator Work?
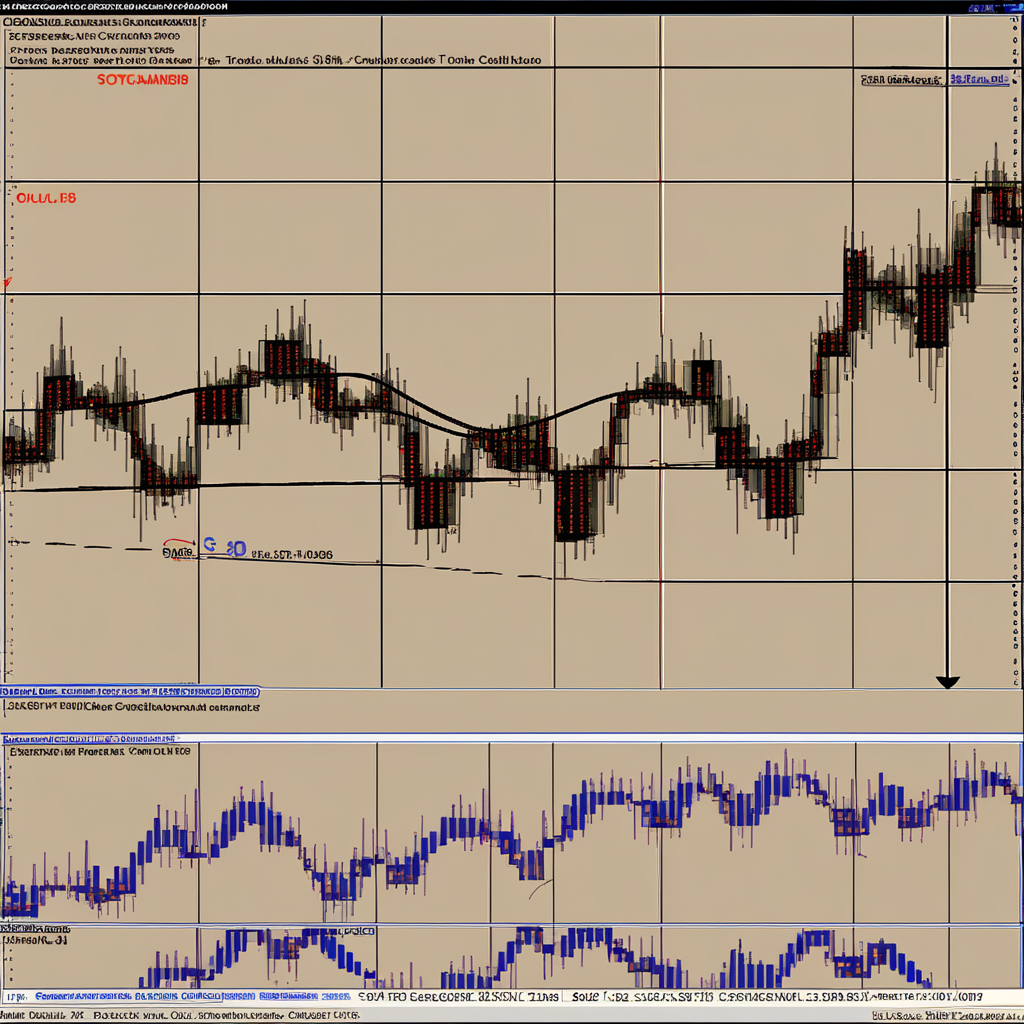
The Stochastic Oscillator is represented by two curves, typically moving between the levels of 80% and 20%. The first curve, known as %K, is the solid orange line, while the second is a 3-period moving average of %K, represented by the blue line.
When both lines are above 80% (in the blue zones at the top), it indicates an overbought market condition. Conversely, when they dip below 20% (in the red zones at the bottom), it signifies an oversold market. These overbought and oversold levels are critical for traders, as they offer potential entry and exit points.
It’s important to note that relying solely on the Stochastic Oscillator for trading decisions is not recommended. To filter signals effectively, traders often use trend direction as a complementary factor. For instance, in a prevailing downtrend, it’s advisable to consider only short positions, and in an uptrend, focus on long trades. Combining the Stochastic Oscillator with other indicators enhances its reliability.
Stochastic Momentum Index (SMI) Explained
In addition to the classic Stochastic Oscillator, traders frequently use a modified version called the Stochastic Momentum Index (SMI). This version combines the traditional Stochastic tool with momentum, providing smoother signals that are less susceptible to market noise.
SMI features two curves that move around a zero line, one being fast and the other short-term. These curves differ in their time periods. While the SMI offers reliable entry and exit signals in flat markets, it’s still advisable to use it alongside other technical tools to enhance accuracy.
The Mathematics Behind the Stochastic Oscillator
Stochastic Indicator Calculation & Formula
Let’s dive into the mathematical formula that underpins the Stochastic Oscillator. The %K value is calculated using the following formula:
[ %K = \frac{{\text{Close Price} – \text{Lowest Price in the Last } n \text{ Periods}}}{{\text{Highest Price in the Last } n \text{ Periods} – \text{Lowest Price in the Last } n \text{ Periods}}} \times 100 ]
Here’s an example of how to calculate %K for a specific bar:
- Close Price = 1.17972
- Lowest Price in the Last 3 Periods = 1.17948
- Highest Price in the Last 3 Periods = 1.17994
Using the formula:
[ %K = \frac{{1.17972 – 1.17948}}{{1.17994 – 1.17948}} \times 100 \approx 52.17% ]
This calculation determines the %K value for that particular period. However, manual calculations like these can be cumbersome. Fortunately, automated Stochastic Oscillator indicators are available through trading platforms, making it much more convenient for traders.
Interpreting Stochastic Indicator Readings
Overbought & Oversold Conditions
One of the key advantages of the Stochastic Oscillator is its ability to help traders identify overbought and oversold market conditions.
- Overbought Condition: This occurs in an uptrend when the %K line crosses above 80%. It signifies that the upward momentum may be slowing down, and a potential reversal to the downside could be imminent. In such situations, traders often consider opening short positions when the %K line reverses from its peak.
- Oversold Condition: In a downtrend, when the %K line falls below 20%, the market is considered oversold. This suggests that the downward momentum might be waning, and a reversal to the upside is possible. Traders typically look for opportunities to enter long positions when the %K line crosses back above 20%.
It’s worth noting that interpreting overbought and oversold conditions should be complemented by an analysis of reversal patterns forming in these regions. A sharp angle of the %K curve often indicates an impending significant price movement.
Bull & Bear Divergences
Divergences are infrequent but highly reliable signals generated by the Stochastic Oscillator:
- Bearish Divergence: Occurs when prices reach new highs, but the %K and %D lines fail to surpass their previous highs, usually in the overbought or oversold region. This suggests a potential reversal to the downside and acts as a sell signal. Traders often open short positions after the moving averages of the indicator cross and a confirming candlestick pattern forms.
- Bullish Divergence: Manifests when prices make new lows, but the %K and %D lines do not reach new lows, typically in the overbought or oversold region. This hints at a potential upward reversal and serves as a buy signal. Traders may enter long positions after the moving averages cross and a confirming candlestick pattern emerges.
Bull & Bear Set-ups
Bullish and bearish set-ups resemble divergences but provide different signals:
- Bullish Set-up: Occurs when the latest high price is lower than the previous high, but the Stochastic Oscillator records a higher high than the last closing price. This implies a short-term decline in price and a potential reversal to the upside. Traders often use this pattern as an entry point for bullish trades preceding an expected price increase.
- Bearish Set-up: Arises when the latest low price has higher lows, but the oscillator forms a lower low than the last closing price. This indicates strong sell signals. However, traders should be cautious with bearish set-ups, as they can sometimes lead to false signals, resulting in price rebounds and reversals.
Choosing Stochastic Oscillator Settings
The Stochastic Oscillator’s effectiveness depends on its parameter settings, particularly the values for %K, %D, and smoothing coefficients. The most commonly used setting is 5, 3, and 3, respectively, for fast, slow, and full Stochastic Oscillators.
- Fast Stochastic Oscillator (5, 3): This setting is known for its responsiveness to market movements but can generate numerous false signals, requiring careful filtering.
- Slow Stochastic Oscillator (5, 3, 3): The slow Stochastic provides smoother curves by applying additional smoothing to %K. While it reduces noise, it also increases lag.
- Full Stochastic Oscillator: This version offers flexibility, allowing traders to customize all three parameters, including the smoothing method. It can be a valuable tool for fine-tuning the indicator to specific trading strategies.
Consideration of Timeframes
The choice of timeframe plays a crucial role in optimizing the Stochastic Oscillator’s settings. For shorter timeframes like M5, M15, and M30, settings of (10, 7, 3) or (7, 3, 3) are suitable. However, on higher timeframes such as H4 and D1, settings of (9, 3, 3) or (14, 3, 3) are preferred to avoid false signals.
Conclusion
The Stochastic Oscillator is a versatile and powerful momentum indicator that can significantly enhance your trading strategies. Whether you’re a day trader or a long-term investor, mastering the Stochastic Oscillator can help you make informed decisions and improve your overall trading success.
Remember that no single indicator should be used in isolation. Combining the Stochastic Oscillator with other technical tools and thorough market analysis will provide you with a more comprehensive view of potential trade opportunities. So, integrate this indicator into your trading arsenal and embark on your journey to trading success with confidence.
What is the Stochastic Oscillator?
The Stochastic Oscillator is a technical analysis indicator used in financial markets to evaluate the momentum of asset prices. It helps traders identify potential reversal points and overbought or oversold conditions.
How does the Stochastic Oscillator work?
The Stochastic Oscillator consists of two lines, %K and %D, which fluctuate between 0 and 100. %K represents the current closing price’s position relative to the high and low prices over a specified period. %D is a moving average of %K. When %K crosses above %D, it generates a bullish signal, and when %K crosses below %D, it generates a bearish signal.
What are the key parameters of the Stochastic Oscillator?
The Stochastic Oscillator typically uses three parameters:
- %K Period: The number of periods used to calculate %K, often set to 14.
- %D Period: The number of periods used to calculate %D, usually set to 3.
- Smoothing: A smoothing coefficient to make the lines smoother, typically set to 3.
How is the Stochastic Oscillator used for trading?
Traders use the Stochastic Oscillator to:
- Identify overbought and oversold conditions: Readings above 80% suggest overbought conditions, while readings below 20% indicate oversold conditions.
- Spot bullish and bearish divergences: When price and the Stochastic Oscillator move in opposite directions, it can signal potential reversals.
- Generate buy and sell signals: Crossovers of %K and %D lines can trigger trading signals.
Can the Stochastic Oscillator be used on different timeframes?
Yes, the Stochastic Oscillator can be applied to various timeframes, from minutes to daily and even weekly charts. The choice of timeframe depends on a trader’s trading style and strategy. Shorter timeframes may generate more frequent signals, while longer timeframes offer a broader perspective on trends.

