
Are you tired of using traditional indicators that fail to provide accurate signals? Look no further, as we introduce you to the revolutionary Stochastic Momentum Index (SMI). This refined indicator will completely transform your trading experience and take it to new heights. With its unparalleled precision and reliability, the SMI is a game-changer in the world of technical analysis.
Unlike other indicators, the SMI combines two powerful concepts: stochastics and momentum. By doing so, it captures both short-term price fluctuations and long-term trends, giving you a comprehensive view of market dynamics. This unique approach sets the SMI apart from its counterparts.
In this article, we will delve into the basics of the Stochastic Momentum Index and explore its advantages over traditional indicators. You’ll learn how to use the SMI for trend identification and discover effective strategies for trading with this refined indicator. We’ll also highlight common mistakes to avoid and provide valuable tips for enhancing your SMI trading strategy. Get ready to revolutionize your trading game with the Stochastic Momentum Index!
Key Takeaways
- The Stochastic Momentum Index (SMI) combines stochastics and momentum to capture short-term fluctuations and long-term trends.
- SMI values help identify overbought and oversold levels in the market, filtering out market noise and providing a smoother and more responsive indicator.
- The SMI incorporates both price and volume information for a comprehensive understanding of market dynamics.
- Strategies for trading with the SMI include incorporating other indicators and analyzing market trends, while risk management is crucial for setting appropriate stop-loss orders.
The Basics of the Stochastic Momentum Index (SMI)
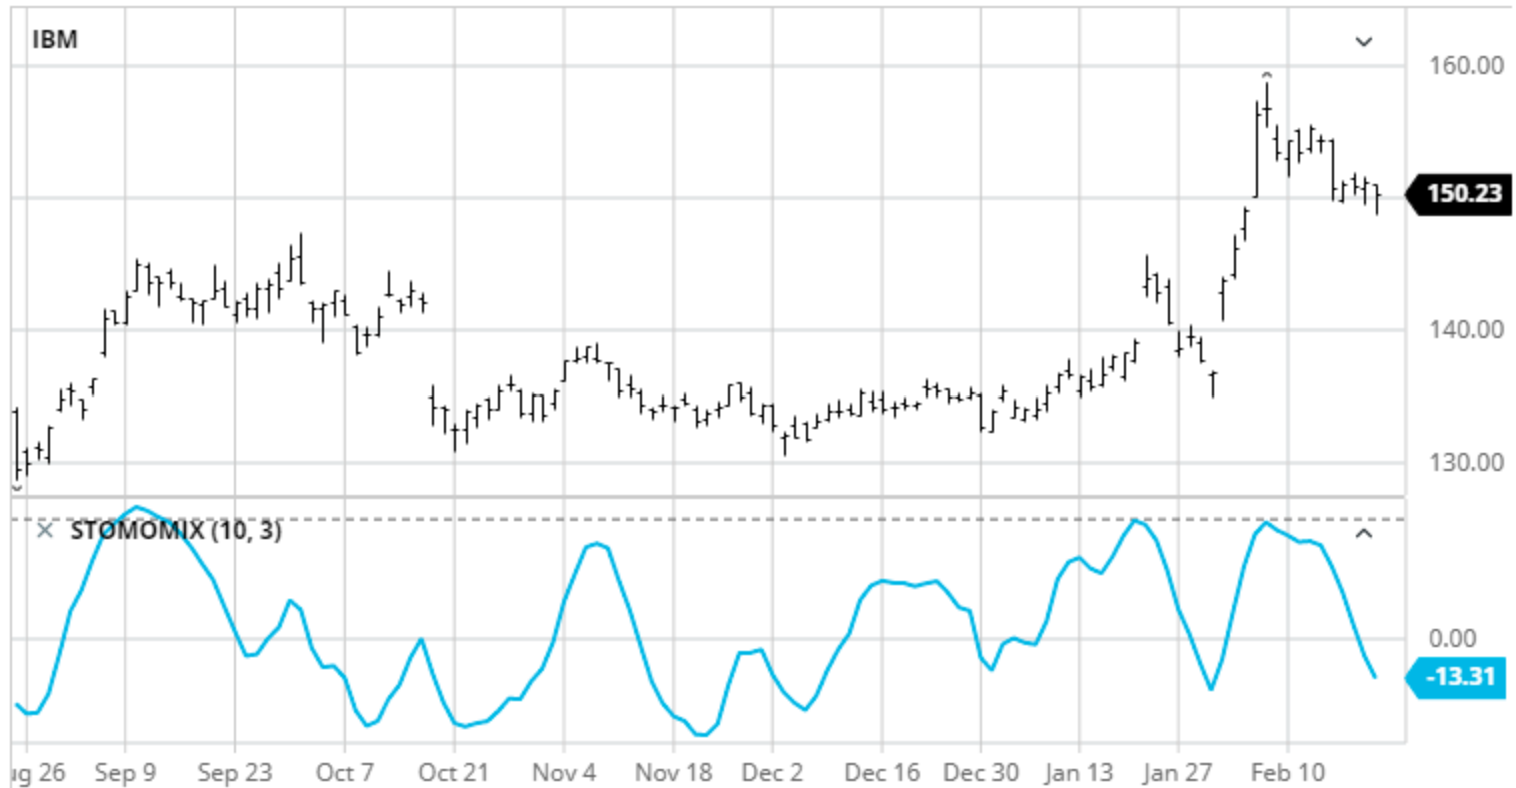
Now let’s dive into the nitty-gritty of the Stochastic Momentum Index (SMI) and discover how this refined indicator can paint a vivid picture of market momentum in your mind. Calculating the SMI involves using the high, low, and close prices over a specific period. It compares the current closing price to the midpoint between the highest high and lowest low within that period.
The resulting value is then smoothed with a moving average to provide a more accurate representation of market momentum. Interpreting SMI values is crucial for identifying overbought and oversold levels. When the SMI crosses above the overbought threshold, it suggests that an asset may be due for a downward correction. Conversely, when it dips below the oversold level, it indicates potential buying opportunities as an upward reversal could occur soon. Understanding these levels can help traders make informed decisions based on market sentiment.
The Advantages of the SMI over Traditional Indicators
The SMI offers a clearer and more dynamic representation of market trends compared to traditional indicators. The limitations of traditional indicators, such as the Moving Average Convergence Divergence (MACD) and Relative Strength Index (RSI), include their sensitivity to market noise and their tendency to lag behind price movements. In contrast, the SMI is designed to filter out market noise by calculating the difference between the current closing price and its midpoint over a specified period.
This calculation allows the SMI to provide a smoother and more responsive depiction of momentum. Additionally, unlike other momentum indicators that rely solely on price data, the SMI incorporates both price and volume information, providing a more comprehensive understanding of market dynamics. Overall, these advantages make the SMI an invaluable tool for traders seeking accurate and timely insights into market trends.
- The SMI filters out market noise
- The SMI is smoother and more responsive than traditional indicators
- The SMI incorporates both price and volume information
How to Use the SMI for Trend Identification
To use the SMI for trend identification, you need to understand how to identify bullish and bearish signals. The SMI can help you recognize when the market is in a bullish or bearish trend by analyzing the momentum and direction of price movements. Additionally, it is important to be able to recognize potential reversal patterns, as these can indicate a change in the current trend and provide opportunities for profitable trades.
Identifying Bullish and Bearish Signals
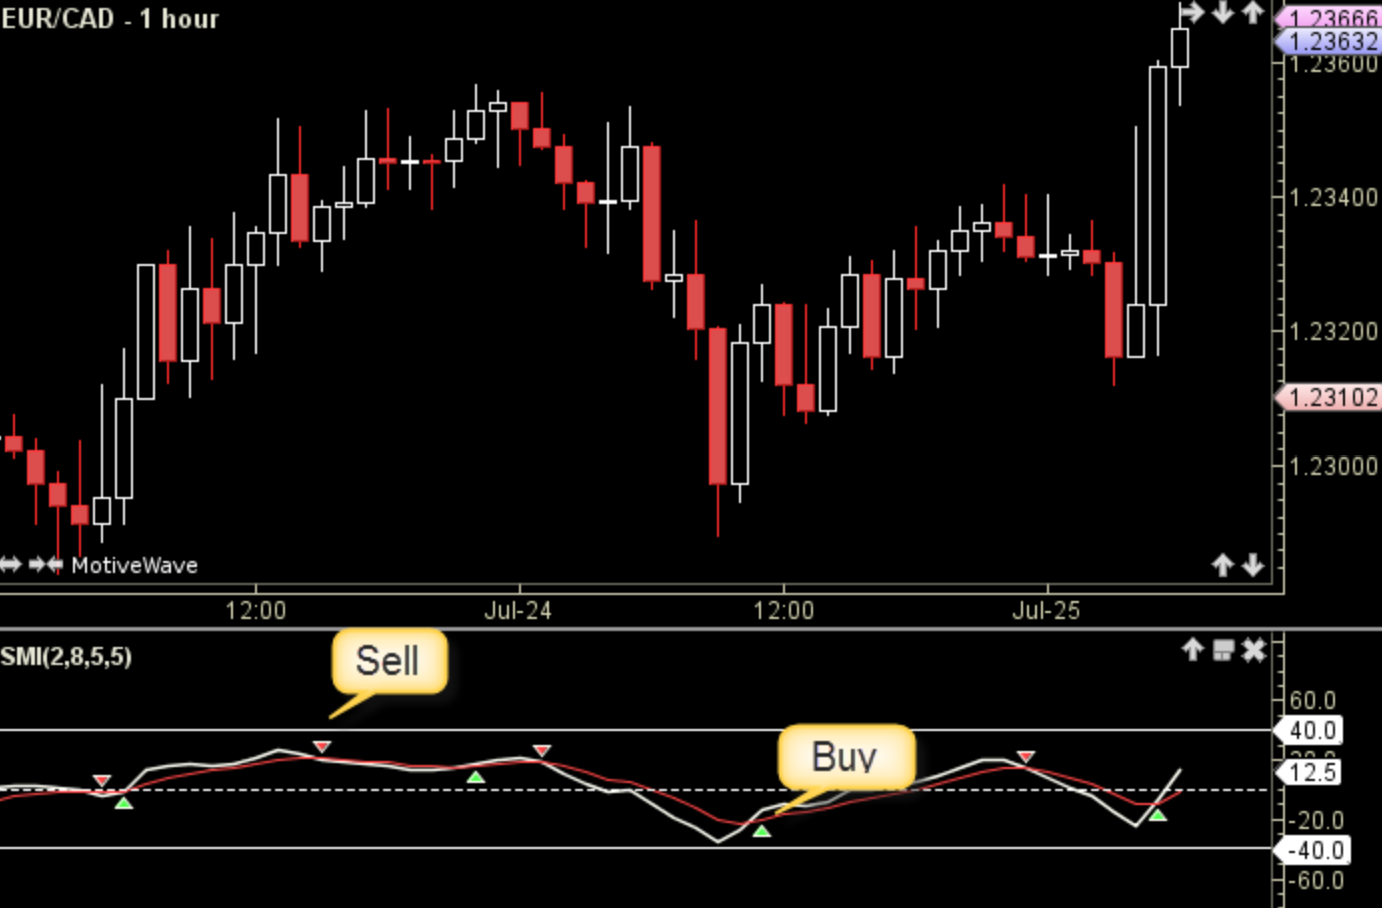
When the stochastic momentum index (smi) curves upwards like a rocket launching into space, it indicates bullish sentiment in the market. Here is a breakdown of how to identify bullish and bearish signals using the SMI:
- Crossing above the signal line: When the SMI line crosses above the signal line, it suggests that buying pressure is increasing and could potentially lead to an uptrend.
- Overbought conditions: If the SMI reaches extremely high levels, it may indicate that the market is overbought and due for a correction or reversal.
- Divergence with price: When there is a divergence between price action and the SMI, such as higher highs in price but lower highs in the SMI, it could suggest a weakening bullish trend.
- Moving averages crossover: If the shorter-term moving average (e.g., 5-day) crosses above the longer-term moving average (e.g., 20-day), it can be seen as a bullish signal.
Understanding these bullish and bearish signals can assist traders in identifying market trends accurately and making informed trading decisions based on them.
Recognizing Potential Reversal Patterns
Start paying attention to potential reversal patterns as they can provide valuable insights into market trends and help you make more informed trading decisions. Reversal patterns are significant indicators in technical analysis that signal a potential change in the direction of a trend. These patterns occur when the price movement of an asset shows signs of reversing its current trend, whether it is from bullish to bearish or vice versa. Recognizing these patterns can give you an edge in predicting future price movements and adjusting your trading strategies accordingly. Common reversal patterns include double tops and bottoms, head and shoulders, and triangles. By studying these patterns and understanding their implications, you can enhance your ability to identify profitable entry and exit points in the market. Keep an eye out for these reversal signals as they could potentially lead to lucrative trading opportunities.
Strategies for Trading with the SMI
You can enhance your trading strategies with the SMI by incorporating various indicators and analyzing market trends. When it comes to scalping techniques, the SMI can be a valuable tool for identifying short-term momentum shifts and potential reversal points. By monitoring the SMI alongside other indicators such as moving averages or support and resistance levels, you can have a more comprehensive view of market conditions and make informed decisions.
Additionally, risk management is crucial when trading with the SMI. Setting appropriate stop-loss orders based on the SMI’s signals can help limit potential losses and protect your capital. It is also important to stay disciplined and follow your predetermined trading plan, taking into account both the SMI’s signals and overall market analysis for optimal results.
Common Mistakes to Avoid when Using the SMI
Now that you have learned about strategies for trading with the SMI, it is important to be aware of common mistakes and interpretation errors that traders often make when using this indicator. By avoiding these pitfalls, you can improve your overall trading performance. Common mistakes include relying solely on the SMI without considering other indicators or market conditions, using incorrect parameter settings for the SMI, and not understanding the limitations of the indicator.
Interpretation errors can occur when traders misinterpret overbought or oversold signals or fail to consider divergences between price and the SMI. It is crucial to thoroughly understand how to use the SMI correctly in order to make informed trading decisions and avoid unnecessary losses.
- Sub-list 1: Examples of common mistakes:
- Relying solely on the SMI without considering other indicators
- Using incorrect parameter settings for the SMI
- Sub-list 2: Examples of interpretation errors:
- Misinterpreting overbought or oversold signals
- Failing to consider divergences between price and the SMI
Tips for Enhancing Your SMI Trading Strategy
Enhancing your trading strategy with the SMI can be achieved by incorporating other technical analysis tools, considering market conditions, and recognizing patterns of divergence between price action and the indicator. By combining the SMI with other indicators such as moving averages or trend lines, you can increase the accuracy of your trading signals. For example, using a moving average crossover in conjunction with the SMI can help confirm buy or sell signals.
Additionally, paying attention to market conditions, such as identifying trending or ranging markets, can provide valuable context for interpreting SMI signals. Lastly, being mindful of divergences between price action and the SMI can indicate potential reversals or changes in momentum. By incorporating these strategies into your trading approach, you can enhance the effectiveness of the stochastic momentum index in guiding your decision-making process.
| Strategies for Enhancing SMI Accuracy | Incorporating SMI with Other Indicators |
|---|---|
| Use Moving Averages | Combine with Trend Lines |
| Identify Market Conditions | Pay Attention to Volume |
| Recognize Divergence Patterns | Utilize Oscillators |
Frequently Asked Questions
What is the mathematical formula behind the Stochastic Momentum Index (SMI)?
The formula for the stochastic momentum index (SMI) calculates the difference between the current closing price and the midpoint of a recent range, divided by the range’s standard deviation. This helps compare SMI to other momentum indicators. Some limitations include false signals during choppy markets and sensitivity to extreme price movements.
Can the SMI be used for any asset class or is it primarily used for stocks?
When analyzing different asset classes, the SMI can be compared to other momentum indicators to see how it performs. However, there may be limitations or drawbacks when using the SMI for asset classes other than stocks.
Does the SMI work better in trending markets or range-bound markets?
The SMI can be effective in both trending and range-bound markets, but it has pros and cons in each. In trending markets, the SMI helps identify strong momentum, while in range-bound markets it may generate false signals.
Are there any specific timeframes that are more suitable for using the SMI?
When considering the optimal timeframes for using the SMI, there are several factors to keep in mind. These include market volatility, trading style, and desired level of accuracy. It’s important to experiment and find what works best for you.
Can the SMI be used as a standalone indicator or should it be combined with other technical indicators for better accuracy?
Combining the SMI with other technical indicators can enhance its accuracy. For example, in a case study, using the SMI alone may result in false signals, but when combined with moving averages or RSI, it provides more reliable buy/sell signals.

