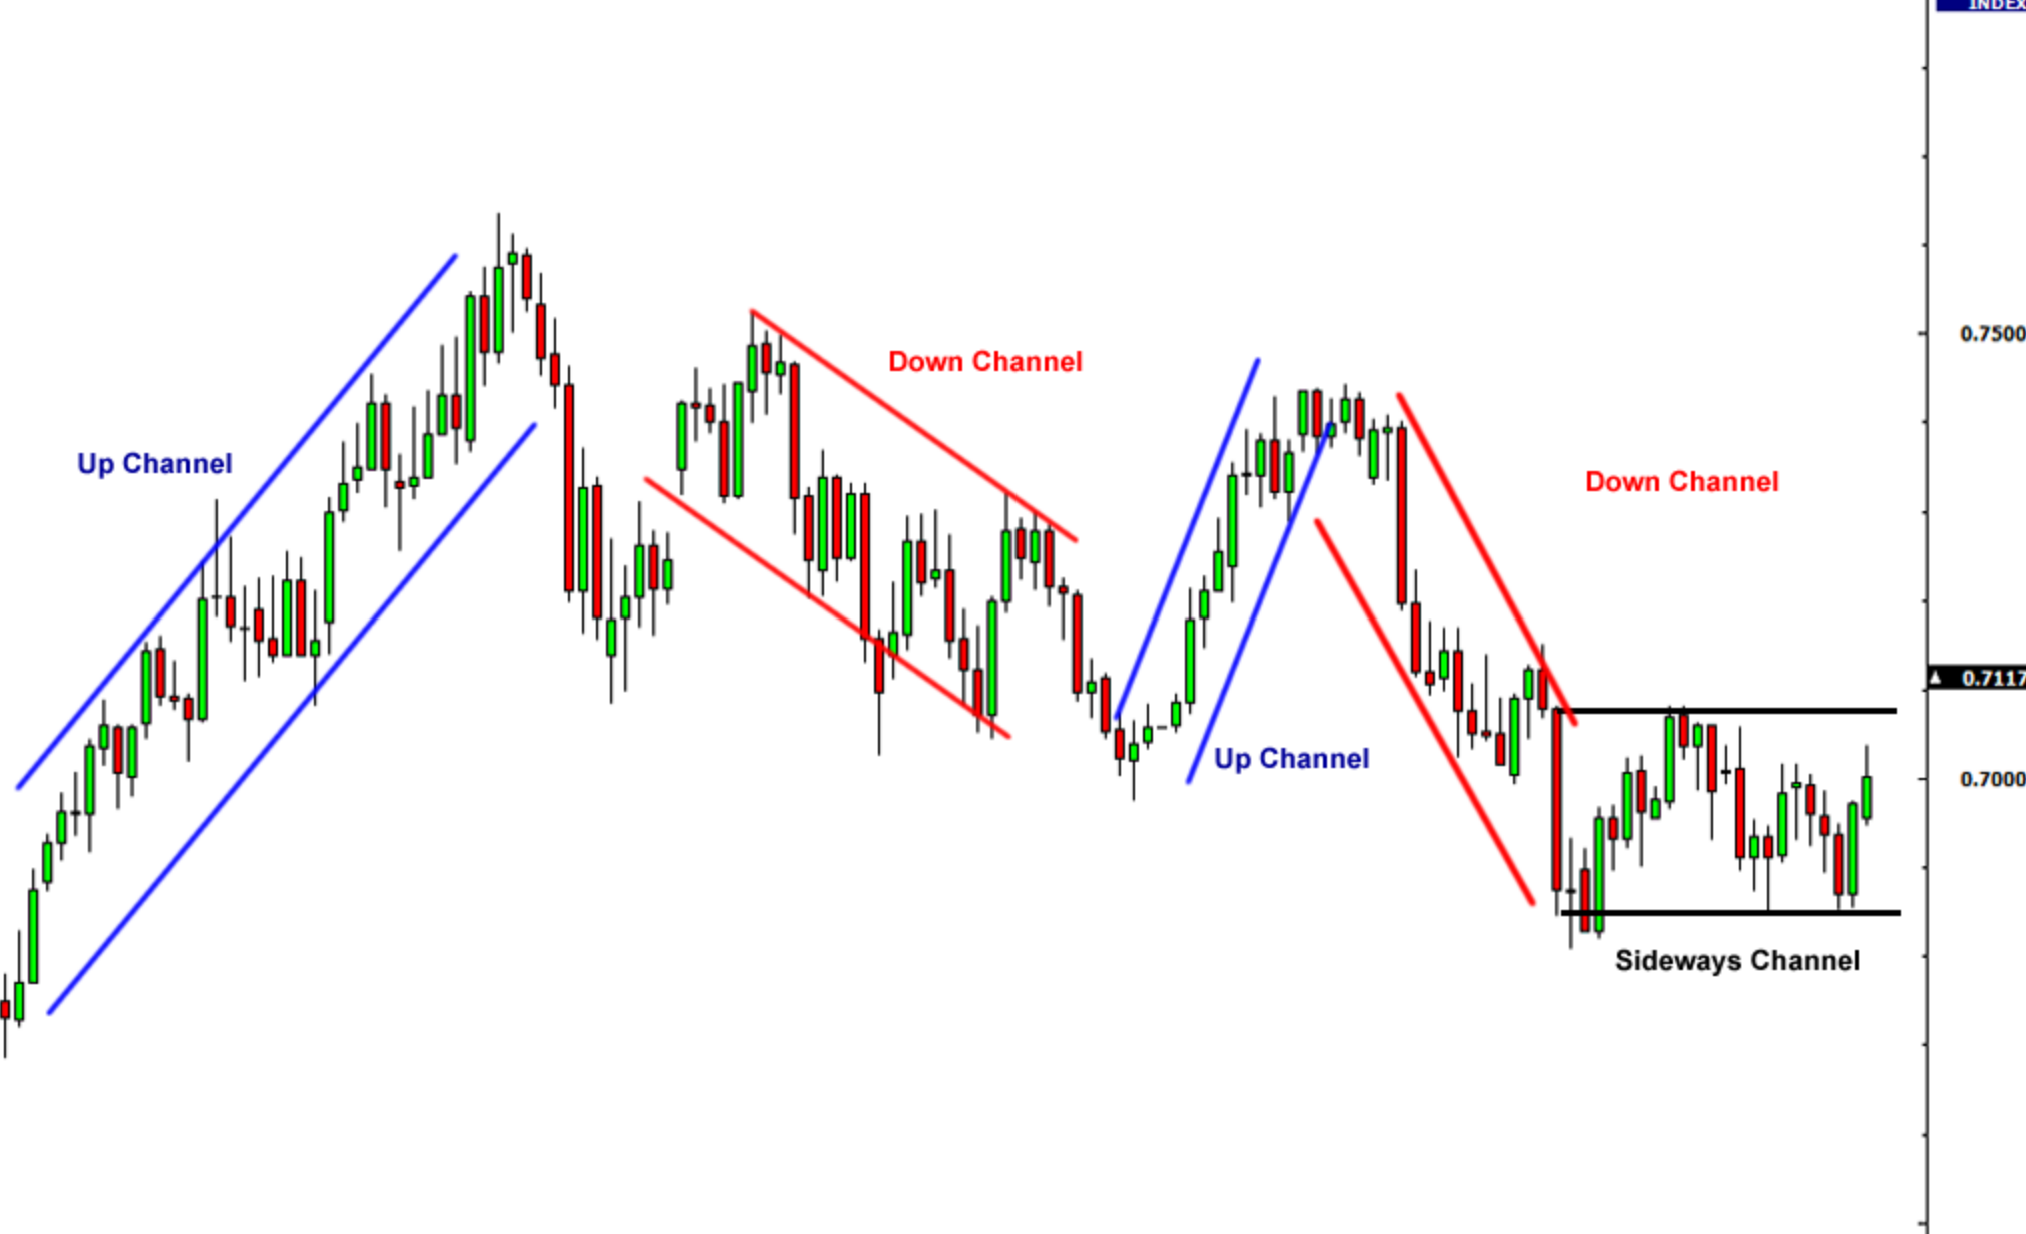
Descending channel patterns are a significant chart pattern in technical analysis that can provide valuable insights into market trends and potential trading opportunities. According to recent data, descending channel patterns have been observed in various financial markets, indicating a decline in prices or a correction within a longer-term uptrend. These patterns are constructed by drawing two parallel lines that slope downwards, with the upper line representing resistance and the lower line indicating strong support.
Traders often employ two main strategies when trading a descending channel pattern. The first strategy involves selling short when prices touch the upper line, taking advantage of potential price reversals. The second strategy involves waiting for a breakout, which can provide a strong buy or sell signal. To confirm breakouts, traders often look for increased volume and additional technical indicators.
While descending channel patterns can be effective tools for analysis, it is essential to use them in conjunction with other analysis tools and consider their limitations. These patterns are prone to false breakouts, and additional confirmation is often necessary. By incorporating descending channel patterns into their analysis, traders can further refine their trading strategies and make more informed decisions.
Key Takeaways
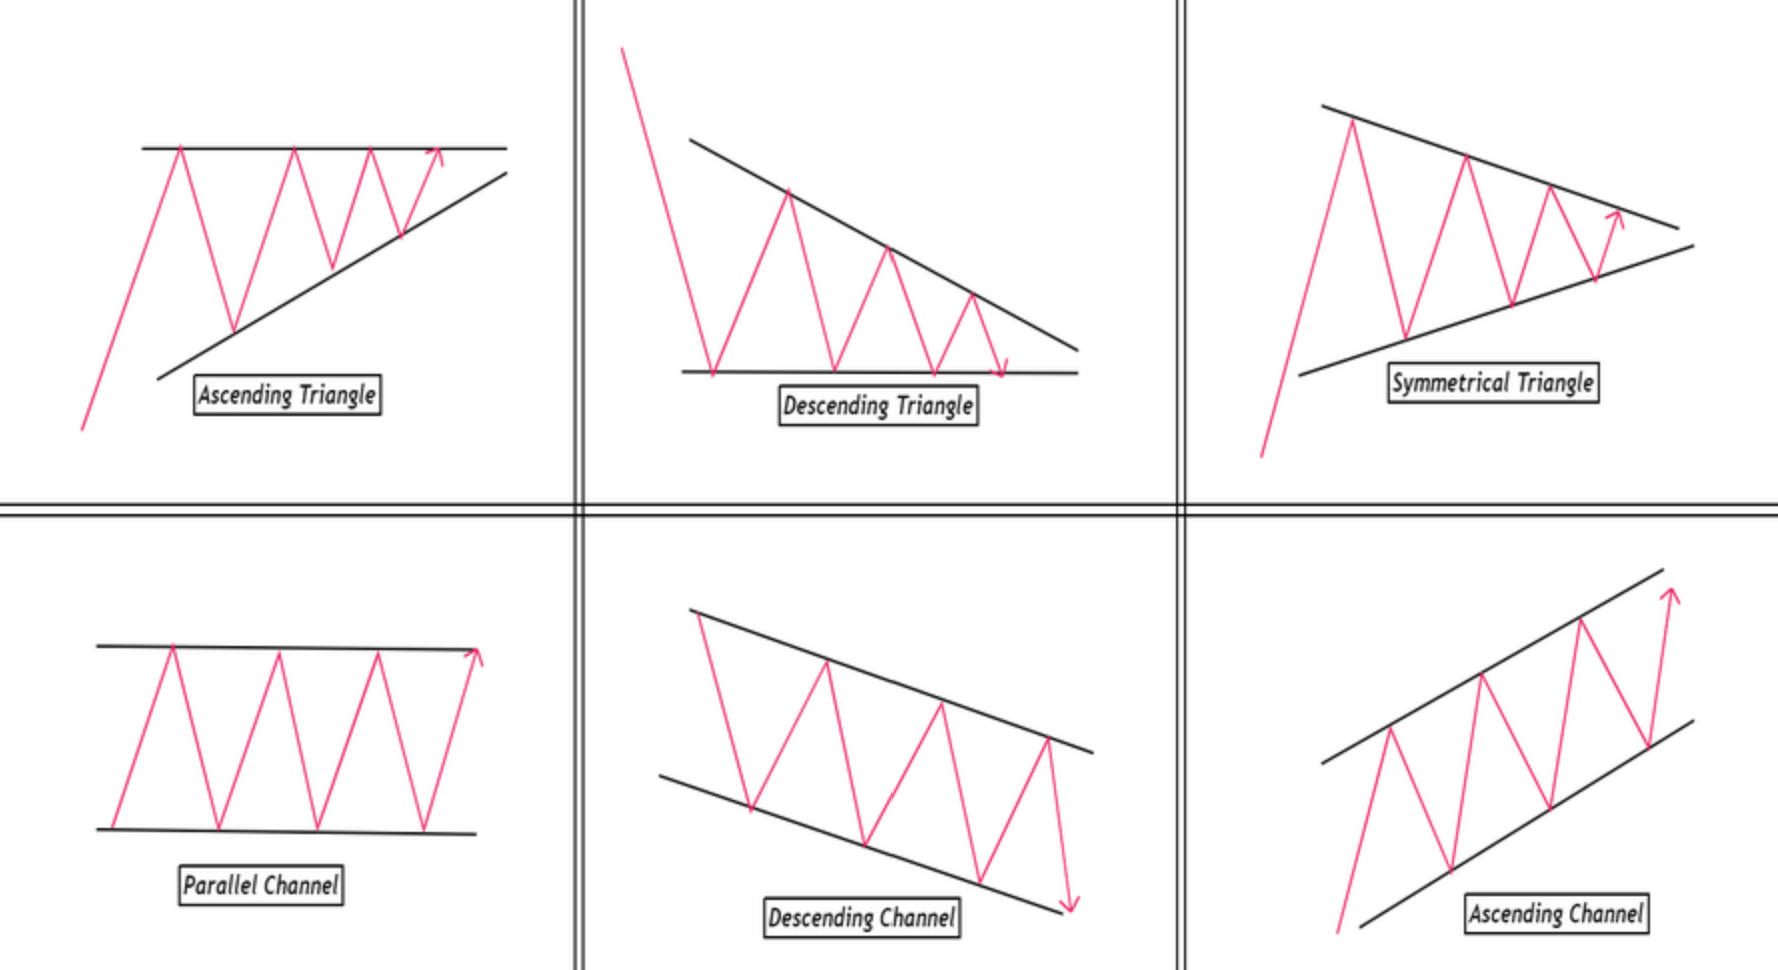
- Descending channels are chart patterns with two parallel lines sloping downwards.
- They are considered bearish patterns, indicating a decline in prices.
- Descending channels can also form within a longer-term uptrend as a correction.
- Traders can use descending channels to identify downtrends or potential uptrend continuations.
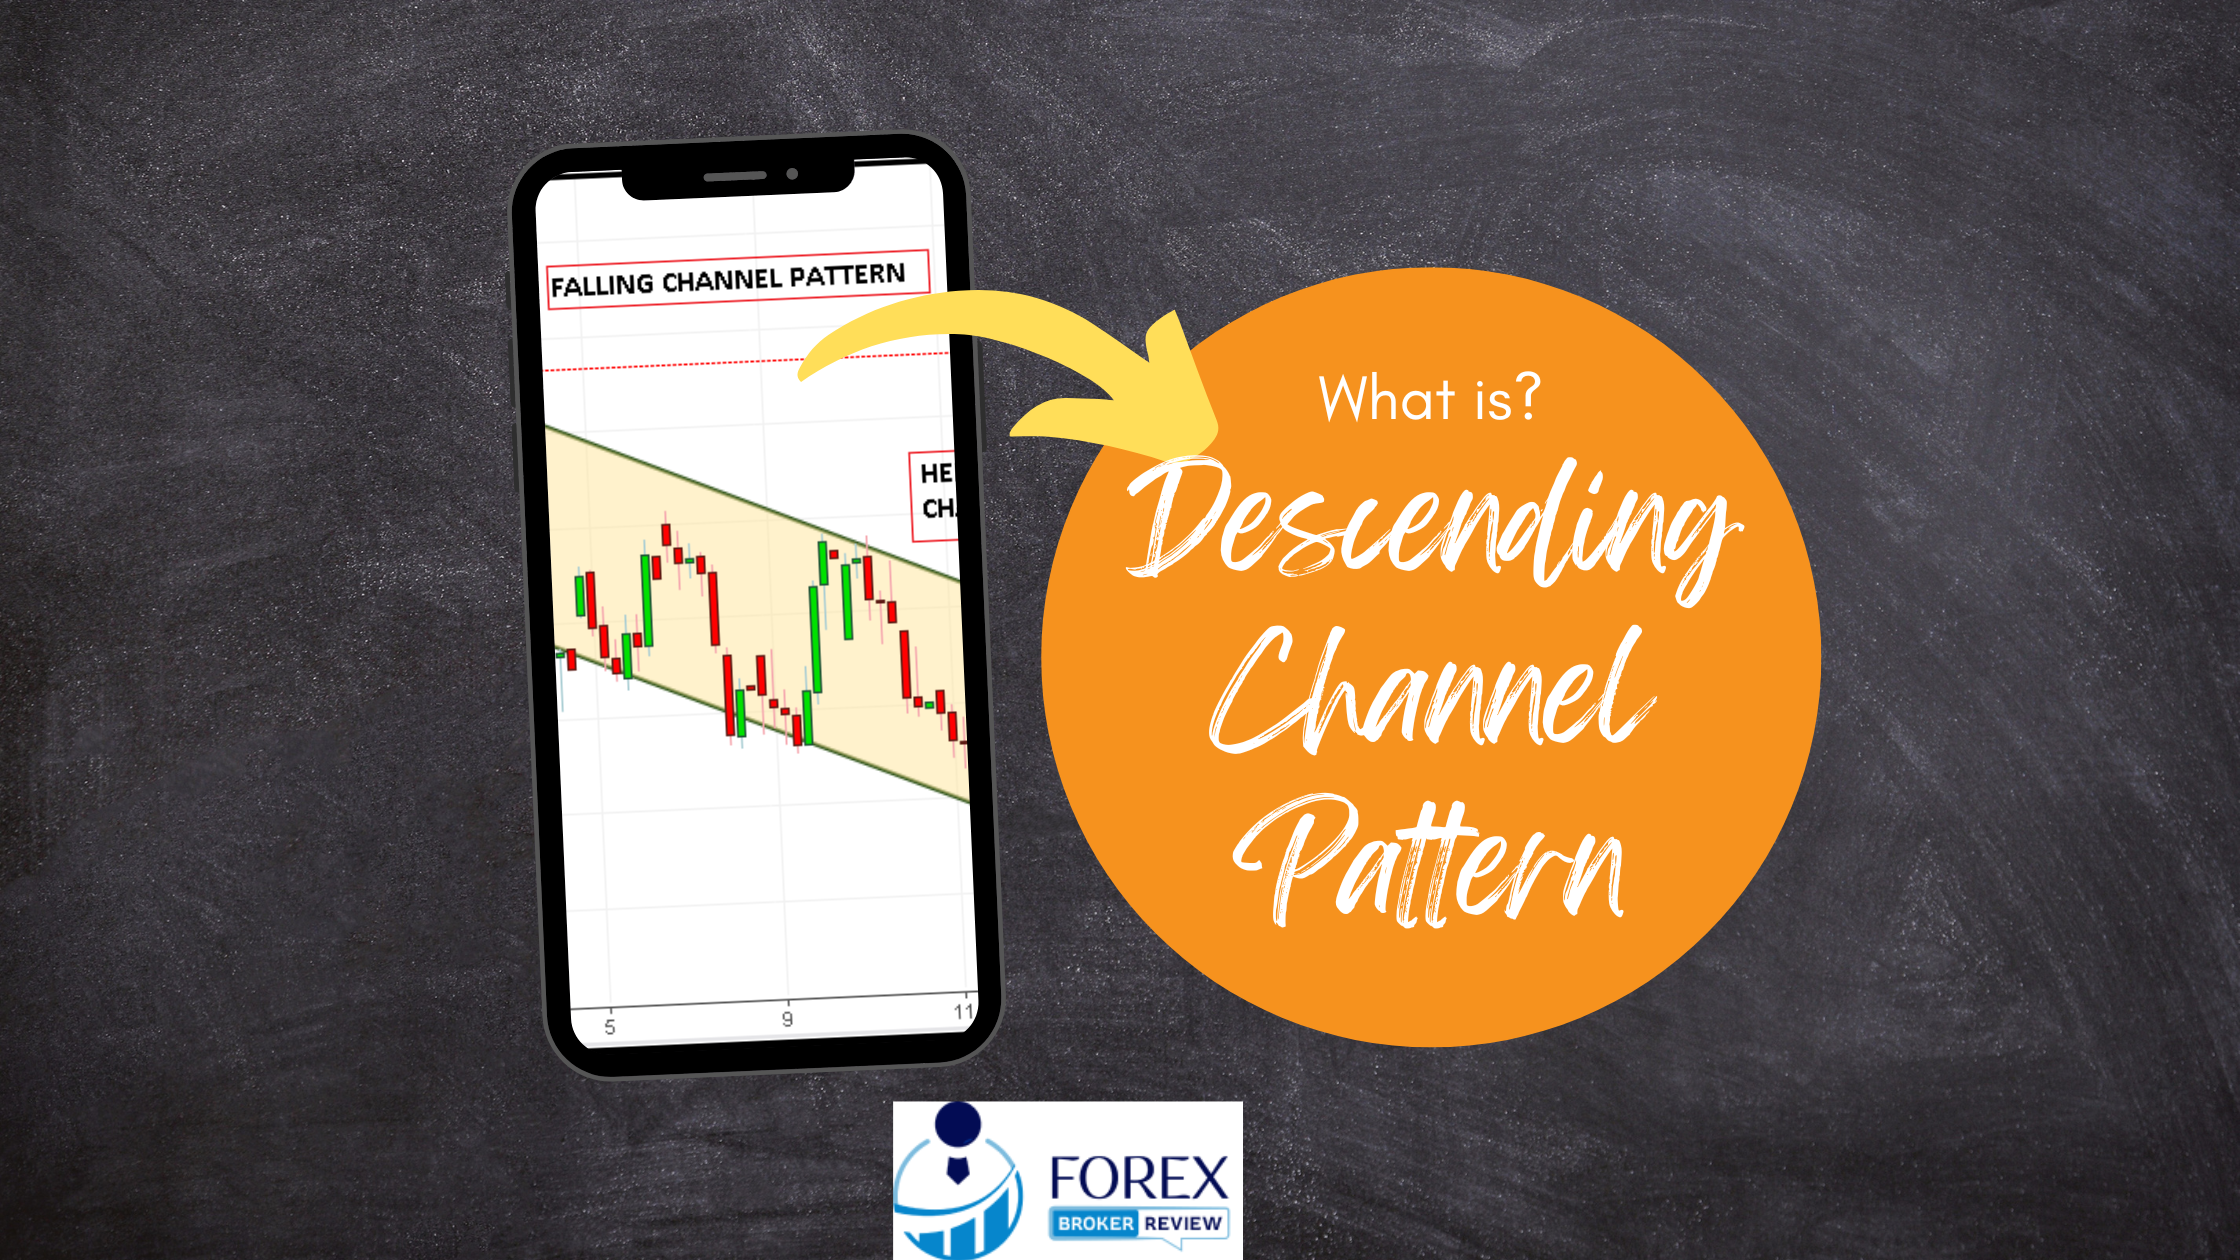
What is Descending Channel Pattern?
A descending channel pattern is a bearish chart pattern characterized by two parallel lines sloping downwards, with the upper line representing resistance and the lower line indicating strong support. This pattern is used by traders to identify potential downtrends or corrections within an uptrend. One of the advantages of the descending channel pattern is that it provides clear levels of support and resistance, making it easier to determine entry and exit points for trades.
Additionally, breakouts from the channel can be strong buy or sell signals, with downward breakouts indicating a strengthening downtrend and upward breakouts suggesting a trend reversal. However, false breakouts can occur, so traders should use other technical indicators or fundamental analysis to confirm breakouts. Real-life examples of successful and unsuccessful trades using descending channels can provide insight into their effectiveness in predicting price movements.
Construction and Characteristics of Descending Channel Pattern
Constructed by drawing two parallel lines that slope downwards, this chart formation exhibits a main trendline that connects at least two highs and a secondary trendline along the lows, representing resistance and strong support respectively. The upper line serves as a barrier for upward price movement, while the lower line indicates a level where buying pressure overwhelms selling pressure.
| Descending Channel Pattern | Characteristics |
|---|---|
| Definition | Bearish chart pattern with two parallel trendlines |
| Construction | – Price moves in a downtrend between trendlines |
| – Highs connect the resistance line | |
| – Lows connect the support line | |
| Characteristics | – Bearish signal, suggests downtrend continuation |
| – Price targets can be projected using trendline | |
| – Volume diminishes, increases on breakdown | |
| – Lasts few weeks to months, continuation pattern |
The construction of the descending channel pattern allows traders to identify potential entry and exit points in the market. By drawing the trendlines, traders can visualize the range in which prices are likely to fluctuate. This pattern also helps in identifying support and resistance levels, which can be used as reference points for making trading decisions. Understanding the construction and characteristics of the descending channel pattern is crucial for effectively utilizing this technical analysis tool in trading.
- The downward sloping lines evoke a sense of bearish sentiment in the market.
- The resistance line represents a level where selling pressure is likely to increase.
- The support line provides a sense of stability and buying opportunity.
- The parallel nature of the lines suggests a consistent downtrend.
- The formation of the trendlines helps in visualizing the potential range of price movements.
Descending Channel Indicator: Trading Strategies
In order to effectively utilize the descending channel pattern in trading, various strategies can be employed. One strategy is to take advantage of shorting opportunities when prices touch the upper line of the channel, which represents resistance. Traders can sell short in anticipation of prices declining back towards the lower line, which indicates strong support. Another strategy is to wait for a reversal breakout, which is considered a stronger signal. Traders can enter a position when prices break out above the upper border, indicating a potential trend reversal.
However, it is important to use other technical indicators such as MACD or RSI and confirm the breakout with a significant increase in volume. When entering a position, it is recommended to do so at around 10% of the channel’s height above the upper border. Profit-taking objectives are often set at the same height above the upper bound of the channel. It is worth noting that while breakouts above the upper border often result in prices moving higher, this is not always the case. Therefore, it is important to use descending channels in conjunction with other technical indicators or fundamental analysis for a comprehensive trading strategy.
Limitations and Considerations
Limitations and considerations of the descending channel pattern must be taken into account when using this tool for trading purposes.
- Advantages and disadvantages:
- Advantages: The descending channel pattern provides a visual representation of price trends and potential trading opportunities. It can help identify downtrends or uptrend continuations.
- Disadvantages: False breakouts can occur within the channel, leading to potential losses. The pattern may not always accurately predict future price movements, and additional technical indicators or fundamental analysis should be used for confirmation.
- Real-life examples and case studies:
- Successful trade example: A trader identifies a descending channel pattern within a longer-term uptrend, waits for a breakout above the upper border with increased volume, and enters a long position. The price continues to rise, resulting in profitable trades.
- Unsuccessful trade example: A trader sells short when prices touch the ceiling of the descending channel pattern, but the price breaks out above the upper border, resulting in a losing trade.
Considering these limitations and using the descending channel pattern in conjunction with other tools can enhance its effectiveness in trading decisions.
Frequently Asked Questions
How can I confirm a breakout in a descending channel pattern?
Market volatility can significantly impact breakouts in a descending channel pattern. Higher volatility often leads to stronger and more reliable breakouts, as it indicates increased market activity and potential shifts in supply and demand dynamics.
Traders should look for breakouts accompanied by higher trading volumes, as this further confirms the validity of the breakout. During a consolidation phase within a descending channel pattern, traders can employ range trading strategies, buying near the lower trendline and selling near the upper trendline, until a breakout occurs.
What are some common technical indicators used in conjunction with descending channels?
Using Fibonacci levels in conjunction with descending channels can provide valuable insights when trading. According to a study, 61.8% (the Fibonacci retracement level) is often considered a key level of support or resistance within a descending channel.
This level is frequently tested before a breakout occurs. Additionally, volume analysis plays a crucial role in identifying breakouts in descending channels. Traders often look for a significant increase in volume to confirm a breakout, as it suggests increased market participation and conviction in the new trend direction.
How can I determine the profit-taking objective when trading a descending channel?
When trading a descending channel, determining the profit-taking objective involves considering the channel’s height above the upper bound. Traders often enter a position at 10% of this height above the upper border. This provides a target for taking profits when the price reaches that level.
Additionally, identifying entry signals in a descending channel can be done by selling short when prices touch the ceiling or waiting for a breakout above the upper border. Breakouts are considered stronger signals and may indicate a trend reversal.
Are there any specific criteria for entering a position when trading a descending channel?
When trading a descending channel, there are specific criteria to consider when entering a position. One key criterion is to wait for a price touch at the upper border or resistance line of the channel. This touch indicates a potential reversal or continuation of the downtrend.
Additionally, traders may consider using other technical indicators, such as MACD or RSI, to confirm the entry signal. It is also important to assess the volume of trades, as a significant increase in volume can provide further confirmation. By adhering to these criteria, traders can increase their chances of successful position trading within a descending channel.
Can descending channels be used to identify potential uptrend continuations?
Descending channels can be used to identify potential uptrend continuations. When a price breakout occurs above the upper border of a descending channel, it confirms the pattern and suggests a potential trend reversal or continuation.
Traders can employ various trading strategies to capitalize on this confirmation, such as entering long positions or buying when the breakout occurs. However, it is important to consider other technical indicators and fundamental analysis to validate the breakout and ensure a higher probability of success.

