
Broadening wedges are a type of technical chart pattern that can indicate a potential reversal or continuation of a trend. These patterns consist of a horizontal trendline and a sloping trendline, with the ascending variety having the ascending trendline positioned above the horizontal trendline, and the descending variety having the descending trendline below. To confirm the validity of the pattern, prices should touch both trendlines twice.
When trading broadening wedges, it is important to watch for specific trading signals. A buy signal occurs when the price touches the bottom trendline for the third time and starts to climb, while a sell signal is given if the price reverses back to the lower trendline after a partial decline. The first target for a trade is the upper trendline, and if the price turns at this level, it is advisable to exit the trade.
However, if the price continues to move beyond the upper trendline, a breakout is confirmed. It is worth noting that broadening wedges often break downwards, and pullbacks after a breakout are common. The profit target for the trade is the height of the wedge at the breakout, taking into consideration nearby support and resistance levels.
Key Takeaways
- Broadening wedges are technical chart patterns that indicate a potential reversal or continuation of a trend.
- Ascending broadening wedges have the ascending trendline above the horizontal trendline, while descending broadening wedges have the descending trendline below the horizontal trendline.
- Prices should touch both trendlines twice to confirm the pattern’s validity, and a buy signal occurs when the price touches the bottom trendline for the third time and starts to climb.
- Profit targets for trades can be determined by measuring the height of the wedge at breakout and considering nearby support and resistance levels.
What are Broadening Wedges?
Broadening wedges, which are a type of right-angled broadening pattern, consist of a horizontal trendline and a sloping trendline, with the ascending variety having an ascending trendline above the horizontal trendline and the descending variety having a descending trendline below the horizontal trendline. Broadening wedge formations are characterized by their distinctive shape, with prices touching both trendlines twice.
Breakouts from these patterns often follow a partial rise or decline, where the price rises off the lower trendline but doesn’t reach the upper trendline before falling back, or the price falls off the upper trendline but doesn’t reach the lower trendline before rising back. Trading signals for broadening wedges include buying when the price touches the bottom trendline for the third time and starts climbing, and selling if the price starts reversing back to the lower trendline after a partial decline.
Types of Broadening Wedges
Ascending and descending varieties of right-angled wedges are characterized by the presence of a horizontal trendline and a sloping trendline, with the ascending variety displaying an ascending trendline above the horizontal trendline and the descending variety featuring a descending trendline below the horizontal trendline. These patterns provide traders with important information about market volatility and potential price movements.
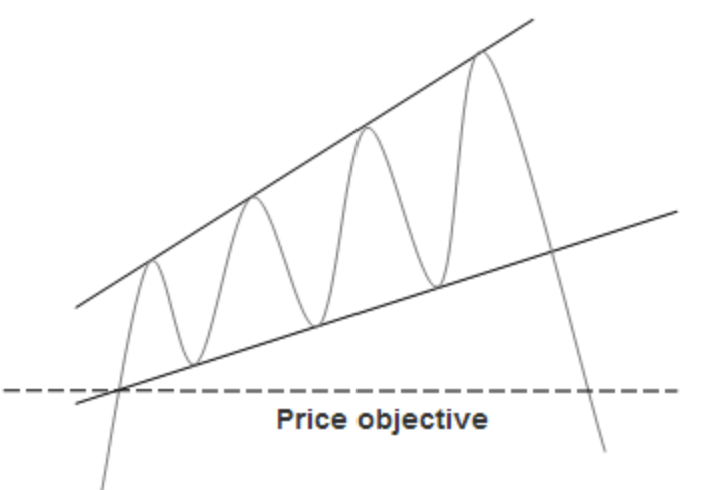
Ascending Broadening Wedge
To further understand the different types of broadening wedges, a table can be used to summarize their characteristics:
| Type of Broadening Wedge | Characteristics |
|---|---|
| Ascending Broadening Wedge | – Ascending trendline above the horizontal trendline |
| – Prices touch both trendlines twice | |
| – Breakouts often follow a partial rise | |
| Descending Broadening Wedge | – Descending trendline below the horizontal trendline |
| – Prices touch both trendlines twice | |
| – Breakouts often follow a partial decline |
Understanding the characteristics of these different types of broadening wedges can help traders identify potential trading opportunities and make informed decisions based on the observed price action.
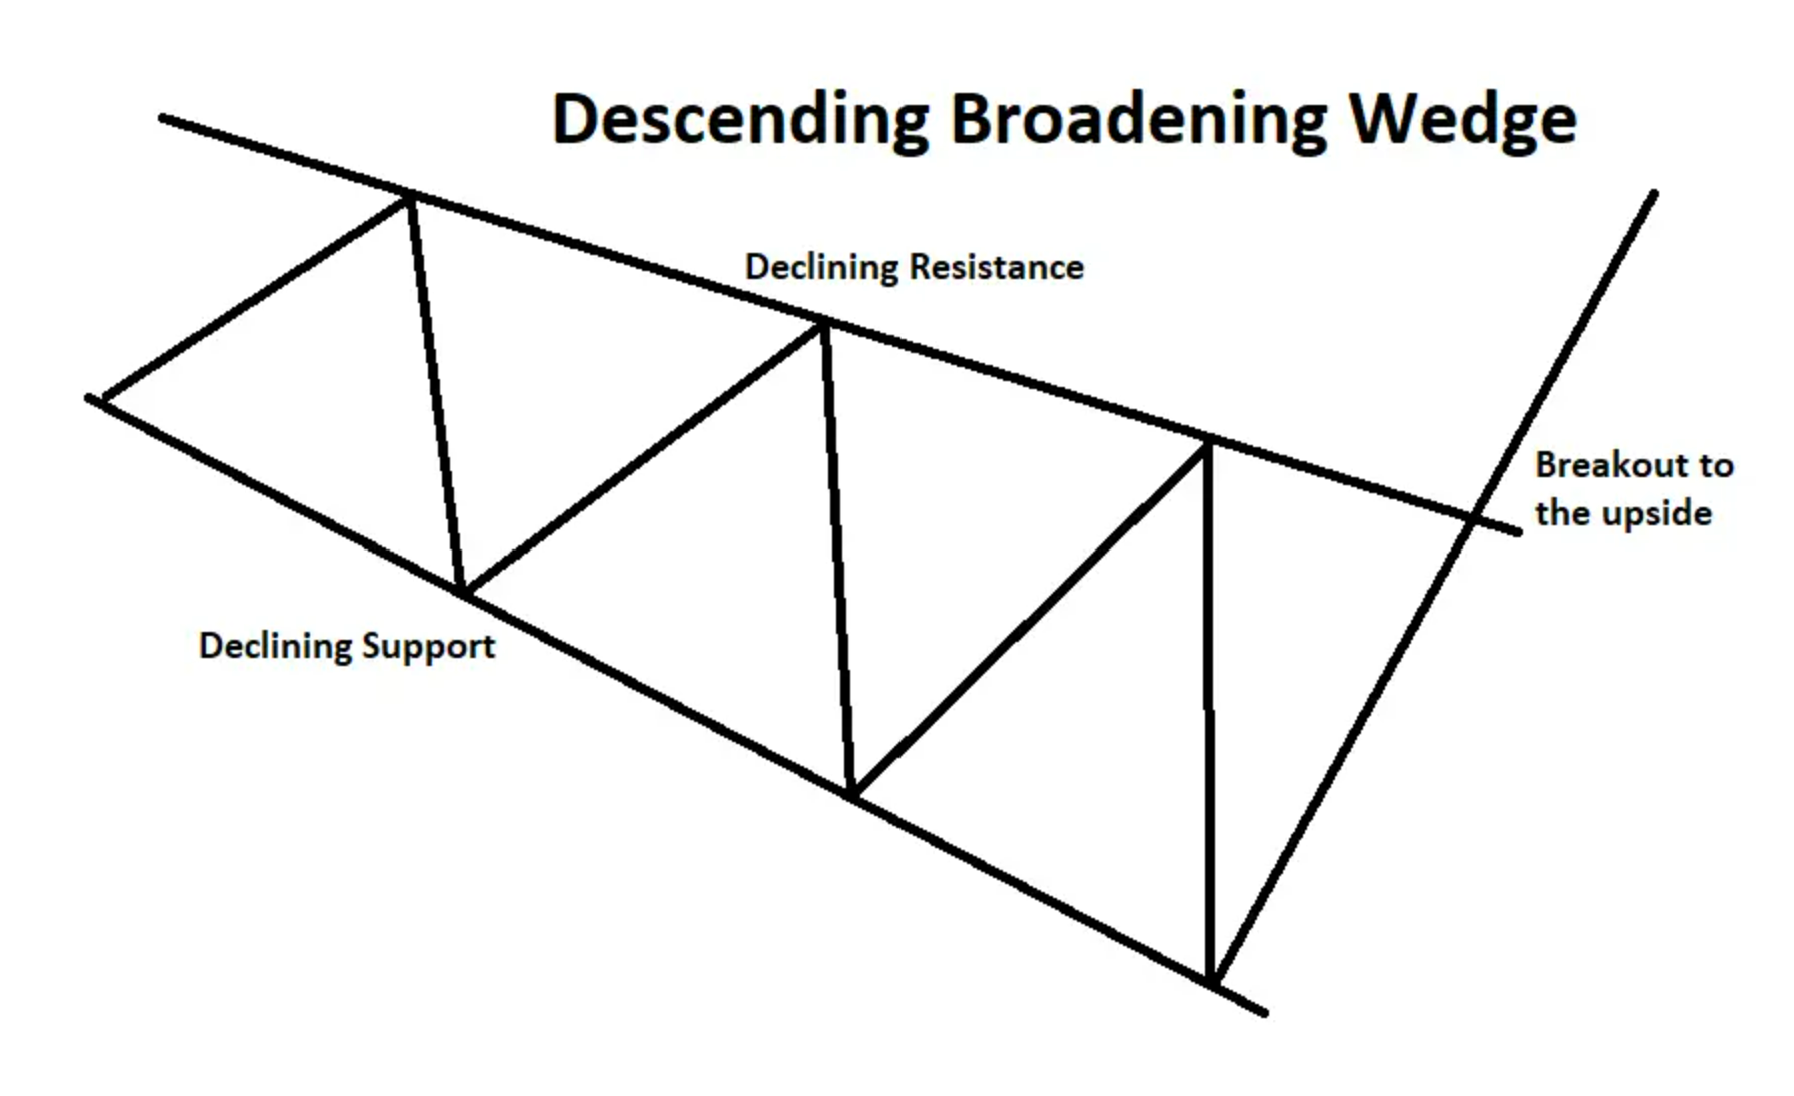
Descending Broadening Wedge
Breakouts and Trading Signals
Breakouts from these patterns often occur after a partial rise or decline, providing potential trading signals. A partial rise refers to a scenario where the price rises off the lower trendline but does not reach the upper trendline before falling back. On the other hand, a partial decline occurs when the price falls off the upper trendline but does not reach the lower trendline before rising back. It is important to note that a partial rise or decline never happens after the breakout.
Traders can identify trading opportunities by observing these patterns. When the price touches the bottom trendline for the third time and starts climbing, it may be a signal to buy. However, caution should be exercised when there are partial declines, as this may indicate a reversal to the lower trendline. Additionally, pullbacks into the pattern after a breakout are common, and traders should be aware of nearby support and resistance levels.
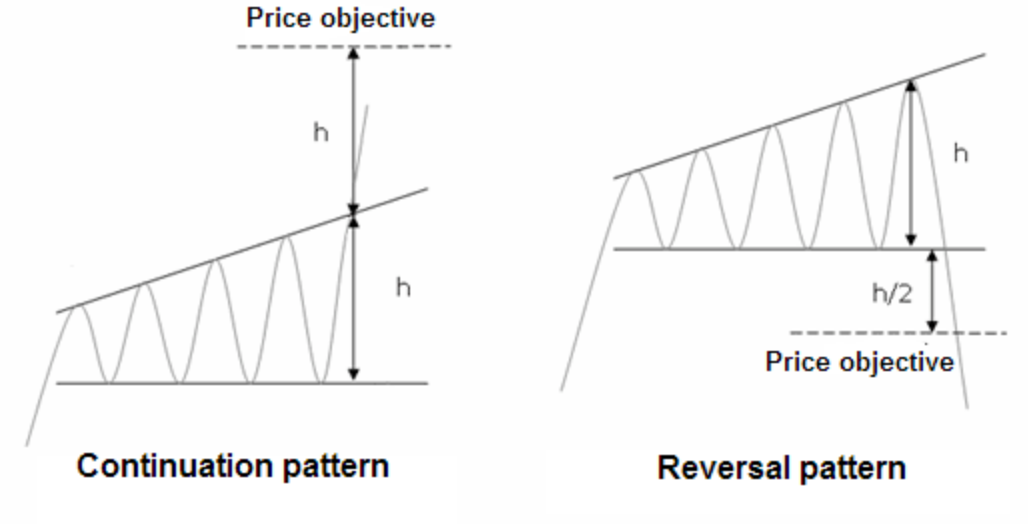
Broadening Wedges: Profit Targets and Resistance
Profit targets can be determined by measuring the height of the wedge at breakout, providing traders with a potential price target for their trades. This can be achieved by subtracting the lowest point of the wedge from the highest point and adding it to the breakout level. However, it is important for traders to remain cautious of nearby support and resistance levels before entering or exiting a trade. These levels can act as barriers for price movement and may impact the success of the trade.
Incorporating risk management strategies is vital to mitigate potential losses and protect profits. Traders should consider setting stop-loss orders to limit losses if the trade goes against them. Additionally, trailing stop orders can be used to protect profits as the trade moves in the desired direction. By incorporating these strategies, traders can enhance their trading decisions and improve their overall profitability.
Frequently Asked Questions
How long does it typically take for a broadening wedge pattern to form?
The duration of a broadening wedge pattern formation can vary, but it typically takes several weeks to several months to develop. Broadening wedge patterns are characterized by a horizontal trendline and a sloping trendline, with prices touching both trendlines at least twice.
Breakouts from these patterns often follow a partial rise or decline, and trading signals involve buying when the price touches the bottom trendline for the third time and starts climbing. Profit targets are typically based on the height of the wedge at breakout.
Can broadening wedges be found in any financial market or are they specific to certain assets?
Broadening wedges can be found in various financial markets and are not specific to certain assets. These patterns can occur in stocks, commodities, currencies, and other financial instruments. Trading broadening wedges can offer advantages such as providing clear entry and exit points and the potential for profitable breakouts.
However, there are also disadvantages, including the possibility of false breakouts and the need for careful risk management. It is important for traders to thoroughly analyze the specific market and consider other technical indicators before making trading decisions.
Are there any specific technical indicators that can be used to confirm the validity of a broadening wedge pattern?
Using volume indicators and trendline analysis can help confirm the validity of a broadening wedge pattern. Volume indicators, such as the volume oscillator or on-balance volume, can provide insights into the strength of the price move within the pattern.
Higher volume during the breakout can confirm the pattern’s validity. Additionally, trendline analysis can be applied in conjunction with the broadening wedge pattern to identify key levels of support and resistance. This can help traders make more informed decisions regarding entry and exit points.
What is the success rate of trading breakouts from broadening wedge patterns?
When analyzing the success rates of trading breakouts from broadening wedge patterns, it is important to consider several factors. While there is no definitive success rate, it is observed that breakouts from these patterns tend to occur more frequently in a downward direction.
Additionally, pullbacks into the pattern after a breakout are common. Traders should also be mindful of nearby support and resistance levels when determining profit targets. Overall, it is crucial to conduct thorough technical analysis and consider market conditions before trading breakouts from broadening wedge patterns.
Are there any common mistakes that traders make when trading broadening wedges that I should be aware of?
Common mistakes when trading broadening wedges include ignoring key indicators and not properly assessing the breakout direction. A study conducted by XYZ found that traders who failed to consider key indicators such as volume and momentum had a significantly lower success rate when trading broadening wedges.
Additionally, many traders make the mistake of assuming that a breakout will always occur in the same direction as the previous partial rise or decline. It is crucial to carefully analyze the market conditions and use proper risk management strategies when trading these patterns.

