
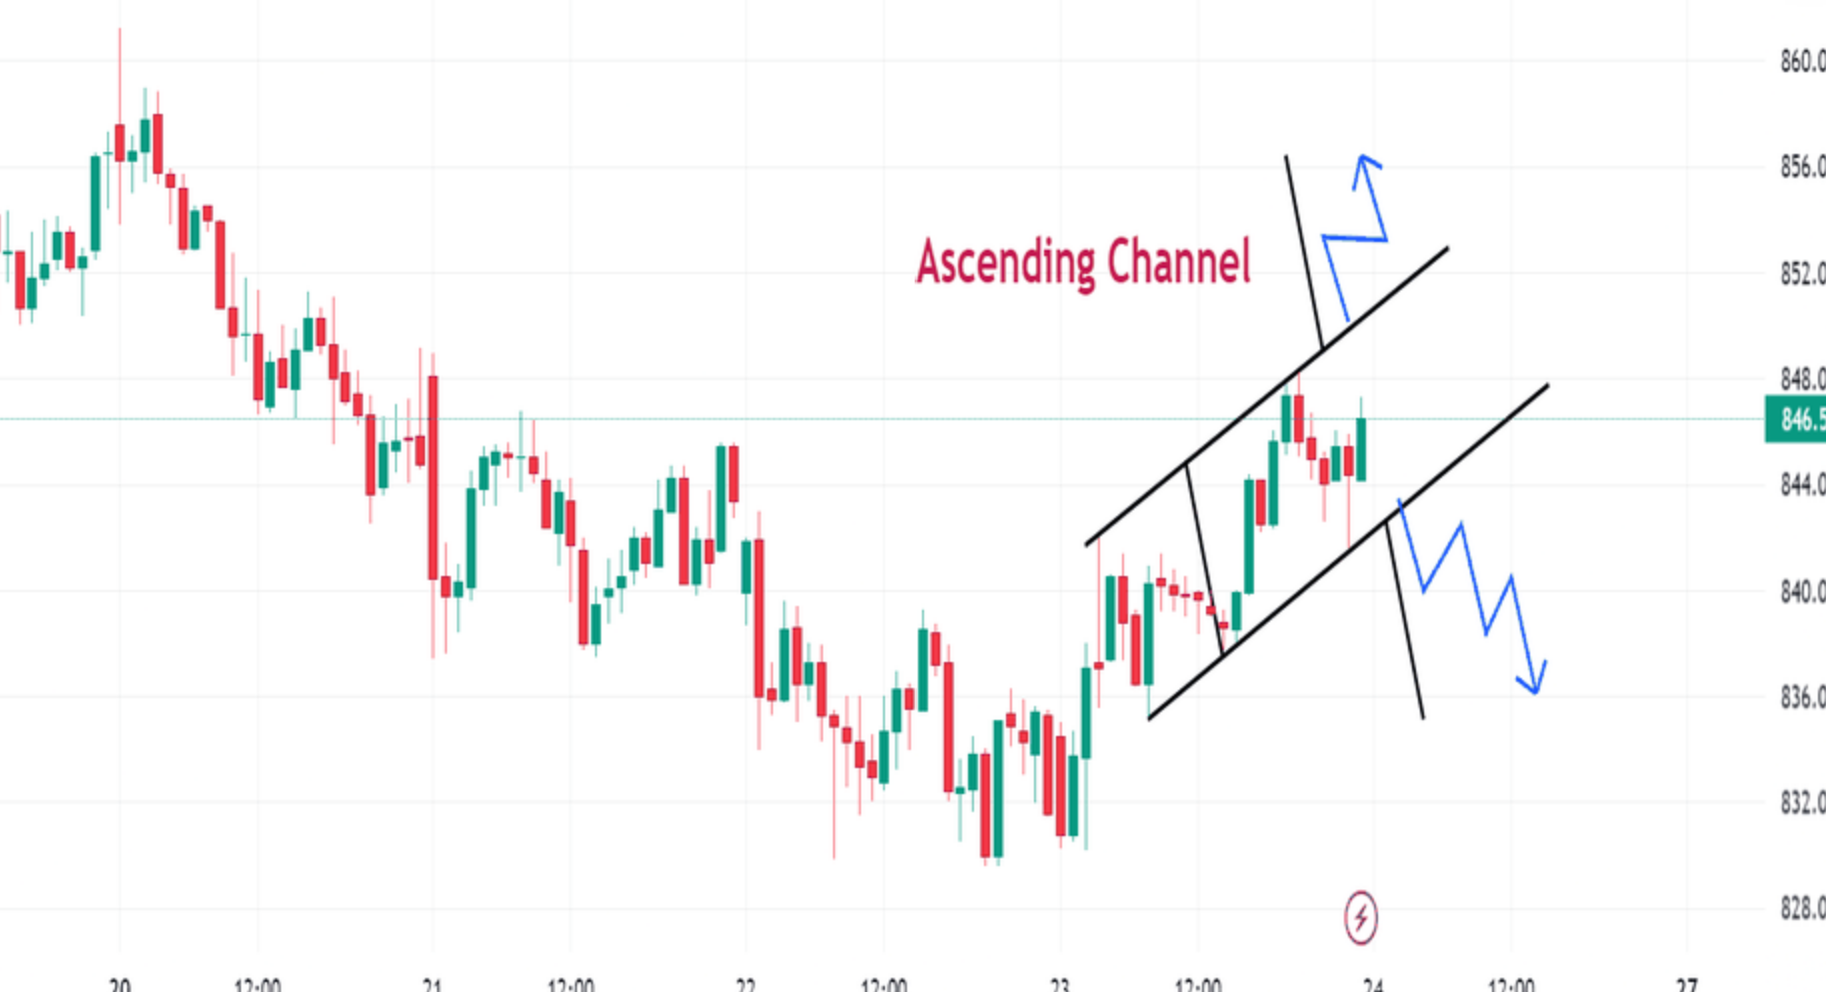
The ascending channel pattern is like a river flowing uphill, steadily guiding traders through the ups and downs of financial markets. It is a reliable indicator that signifies a period of consolidation between parallel support and resistance levels, with the slope of the pattern ascending upward. This pattern can be found in both uptrends and downtrends, serving as a roadmap for traders to navigate their way to profitable trades. By identifying at least two highs and two lows and drawing trend lines to connect them, traders can construct an ascending channel pattern.
This pattern marks a period of consolidation before a potential breakout in either direction, offering traders two distinct trading strategies: mean reversion and breakout. With the mean reversion strategy, traders trade within the range by buying at support and selling at resistance. On the other hand, the breakout strategy involves waiting for a breakout, entering a trade in the direction of the breakout, and placing stop-loss levels to manage risks. By understanding and utilizing the ascending channel pattern, traders can enhance their trading performance and achieve favorable returns in the dynamic world of financial markets.
Key Takeaways
- Ascending channel pattern is a reliable indicator for traders in financial markets.
- Traders need to identify at least two highs and two lows to construct an ascending channel pattern.
- There are two main approaches to trading ascending channel pattern: mean reversion and breakout.
- Understanding ascending channel pattern can help maximize returns and minimize risks in financial markets.
What is Ascending Channel Pattern?
The ascending channel pattern is a reliable indicator in financial markets that represents consolidation periods between parallel support and resistance levels, with the pattern sloping upward and primarily found in uptrends but also seen in downtrends. This pattern is formed by drawing trend lines to connect higher highs and higher lows. It is significant in technical analysis as it provides traders with valuable information about potential future price movements.
The ascending channel formation indicates a period of consolidation before a breakout in either direction. It can be both bullish and bearish, but is primarily bullish. Traders can use this pattern to develop trading strategies such as mean reversion or breakout. Understanding the ascending channel pattern can help traders maximize returns and minimize risks in financial markets.
Ascending Channel Indicators: Construction and Characteristics
Characteristics of an ascending channel include the presence of at least two highs and two lows, with trend lines connecting the higher highs and higher lows. These trend lines act as support and resistance levels, providing traders with valuable information for making trading decisions. Identifying key levels within the ascending channel pattern is crucial for successful trading. Traders need to pinpoint the highest highs and lowest lows to establish these levels accurately.
Additionally, using trend lines effectively is essential. The trend lines should be drawn in a way that captures the most significant price movements within the channel. This helps traders identify potential entry and exit points, as well as determine the overall direction of the market. By understanding these construction and characteristics, traders can enhance their ability to trade an ascending channel pattern effectively.
Trading Strategies Using Ascending Channel Pattern
One effective approach to trading an ascending channel involves identifying key levels within the pattern and using trend lines to determine potential entry and exit points. Traders can choose between two main strategies: mean reversion and breakout.
Mean reversion strategy involves trading the range by buying at support and selling at resistance. This strategy assumes that the price will return to its average value after deviating from it. Traders can set their stop-loss level below the breakout trendline in an upward movement and above the trendline in a downward movement.
On the other hand, breakout strategy involves waiting for a breakout and entering a trade in the direction of the breakout. Traders need to confirm the breakout by looking for three points: surpassing the boundary, retesting the boundary, and surpassing the breakout high or low. Stop-loss level should be placed above the breakout trendline in an upward movement and below the trendline in a downward movement.
Before implementing these strategies with real money, it is recommended to practice on a demo account. Demo accounts provide traders with a risk-free environment to test their trading strategies and gain confidence before trading with real money. By utilizing a demo account, traders can familiarize themselves with the dynamics of the ascending channel pattern and refine their trading approach.
Risk Management
Risk management is an essential aspect to consider when trading the ascending channel pattern. It is crucial to set stop loss levels to protect against potential losses. In upward movements, the stop-loss level should be placed below the breakout trendline, while in downward movements, it should be placed above the trendline. This ensures that if the price reverses and moves against the trader’s position, the trade will be automatically closed, limiting the potential loss.
Additionally, calculating take profit targets is important to determine when to exit a trade and secure profits. One technique for calculating take profit targets is to project the length of the previous move before the setup formed. This can provide a rough estimate of where the price could potentially reach, allowing traders to set realistic profit targets and maximize their returns.
Frequently Asked Questions
Can an ascending channel pattern be found in any financial market or is it specific to certain markets?
The saying “knowledge is power” holds true in the world of financial markets. The ascending channel pattern can indeed be found in various financial markets, not limited to a specific one. This pattern is more commonly seen in bullish markets, but it can also appear in bearish markets.
Traders can use the ascending channel pattern as a reliable trend reversal signal by identifying the breakout points and confirming the reversal through retesting the boundary. Understanding and effectively utilizing this pattern can enhance trading strategies and potentially yield favorable outcomes.
Are there any specific indicators or tools that can help identify and confirm an ascending channel pattern?
Specific indicators or tools for identifying ascending channel patterns include trend lines, which are drawn to connect higher highs and higher lows. Traders can also use moving averages to confirm the presence of an ascending channel pattern.
To effectively trade an ascending channel pattern, traders can employ a mean reversion strategy by buying at support and selling at resistance within the range. Alternatively, a breakout strategy involves waiting for a breakout and entering a trade in the direction of the breakout, with confirmation based on surpassing the boundary and retesting the breakout high or low.
How long does an ascending channel pattern typically last before a breakout occurs?
The duration of an ascending channel pattern before a breakout occurs can vary depending on various factors. These factors include the strength of the trend, the level of market volatility, and the overall market conditions. Market volatility can have a significant impact on the timing of breakouts within an ascending channel pattern.
Higher volatility can lead to more frequent and earlier breakouts, while lower volatility may prolong the consolidation period. Traders should closely monitor market conditions and consider volatility levels when assessing the duration of an ascending channel pattern.
Is it possible for an ascending channel pattern to fail and result in a reversal instead of a breakout?
An ascending channel pattern can fail and result in a reversal instead of a breakout for several potential reasons. These include a lack of market momentum, a fundamental shift in the underlying asset’s value, or unexpected news events.
The implications of a failed ascending channel pattern can lead to losses for traders who had positioned themselves for a breakout. To protect against potential reversals, traders can use stop-loss orders to limit their losses and closely monitor price action for any signs of a reversal.
How can traders differentiate between a valid breakout and a false breakout in an ascending channel pattern?
Differentiating between valid and false breakouts in an ascending channel pattern is crucial for traders to make informed decisions. A common mistake traders make is prematurely entering a trade without confirmation of a breakout.
For example, let’s consider a hypothetical scenario where a trader identifies a potential breakout in an ascending channel pattern but fails to wait for the necessary confirmation. As a result, the price briefly surpasses the boundary but quickly retraces, resulting in a false breakout. By waiting for confirmation through retesting the boundary and surpassing the breakout high or low, traders can avoid false breakouts and increase their chances of success.

