In the vast world of financial markets, where patterns and trends often dictate investment decisions, the Gartley pattern stands out as a powerful tool for traders. This Fibonacci-based harmonic chart pattern, introduced by H.M. Gartley in 1935, has since evolved and refined by Larry Pesavento, offering traders a systematic approach to identify reaction highs and lows in the market.
The Gartley pattern’s unique structure, consisting of specific retracement levels between points 0, 1, 2, 3, and 4, enables traders to generate buy signals and set stop-loss and take-profit levels effectively. However, it is essential to remember that this pattern should be used alongside other technical analysis tools for confirmation.
By combining the Gartley pattern with other chart patterns and indicators, traders can gain valuable insights into the timing and magnitude of price movements. With its proven track record, the Gartley pattern has become an indispensable resource for traders seeking potential trading opportunities in the financial markets.
Key Takeaways
- The Gartley pattern is a harmonic chart pattern based on Fibonacci numbers and ratios.
- Gartley patterns help traders identify reaction highs and lows.
- The pattern is complete at point 4, and buy signals are generated.
- The Gartley pattern can be used in combination with other chart patterns and indicators.
Credits: surgetrader.com
What is the Gartley Pattern?
The Gartley pattern, introduced by H.M. Gartley in 1935 and later modified by Larry Pesavento, is a harmonic chart pattern that utilizes Fibonacci numbers and ratios to identify reaction highs and lows in the market.
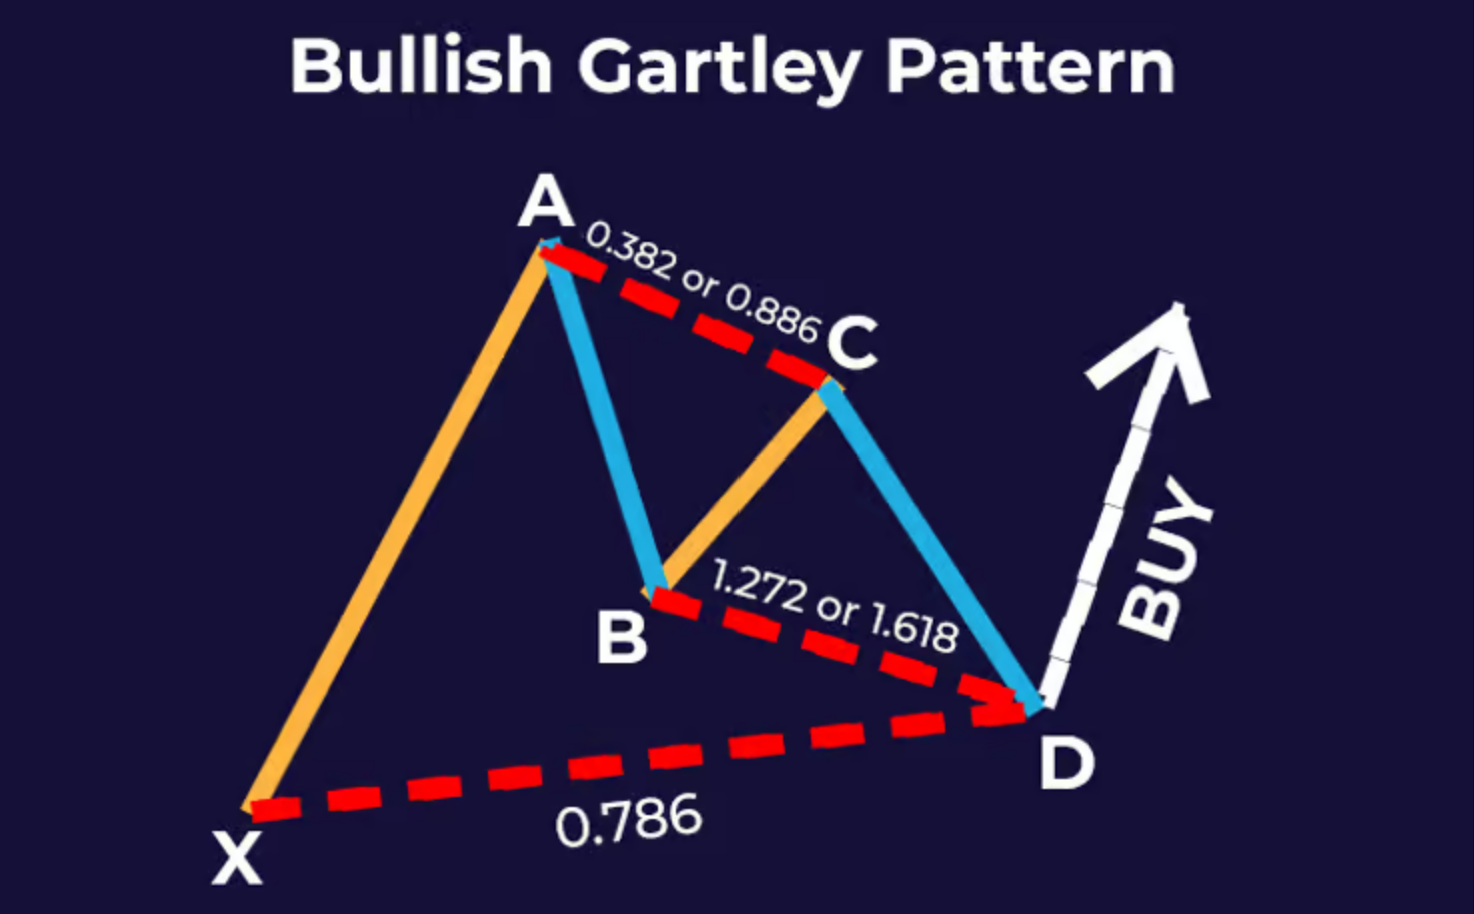
To identify Gartley patterns, traders look for specific structure and retracement levels. The pattern consists of five points, labeled as 0, 1, 2, 3, and 4, and follows specific retracement ratios. The retracement between points 0 and 2 should be 61.8%, while point 3 should be a 38.2% retracement from point 1.
Once the pattern is complete at point 4, buy signals are generated. Traders often use point 0 as a stop-loss level and point C as the take-profit level.
Common trading strategies for Gartley patterns involve combining them with other chart patterns and indicators for confirmation.
Gartley Pattern Structure
In the structure of the Gartley pattern, there are distinct points labeled 0, 1, 2, 3, and 4, each serving a specific purpose in identifying the pattern. These points play a crucial role in determining the validity of the pattern and providing potential entry and exit points for traders.
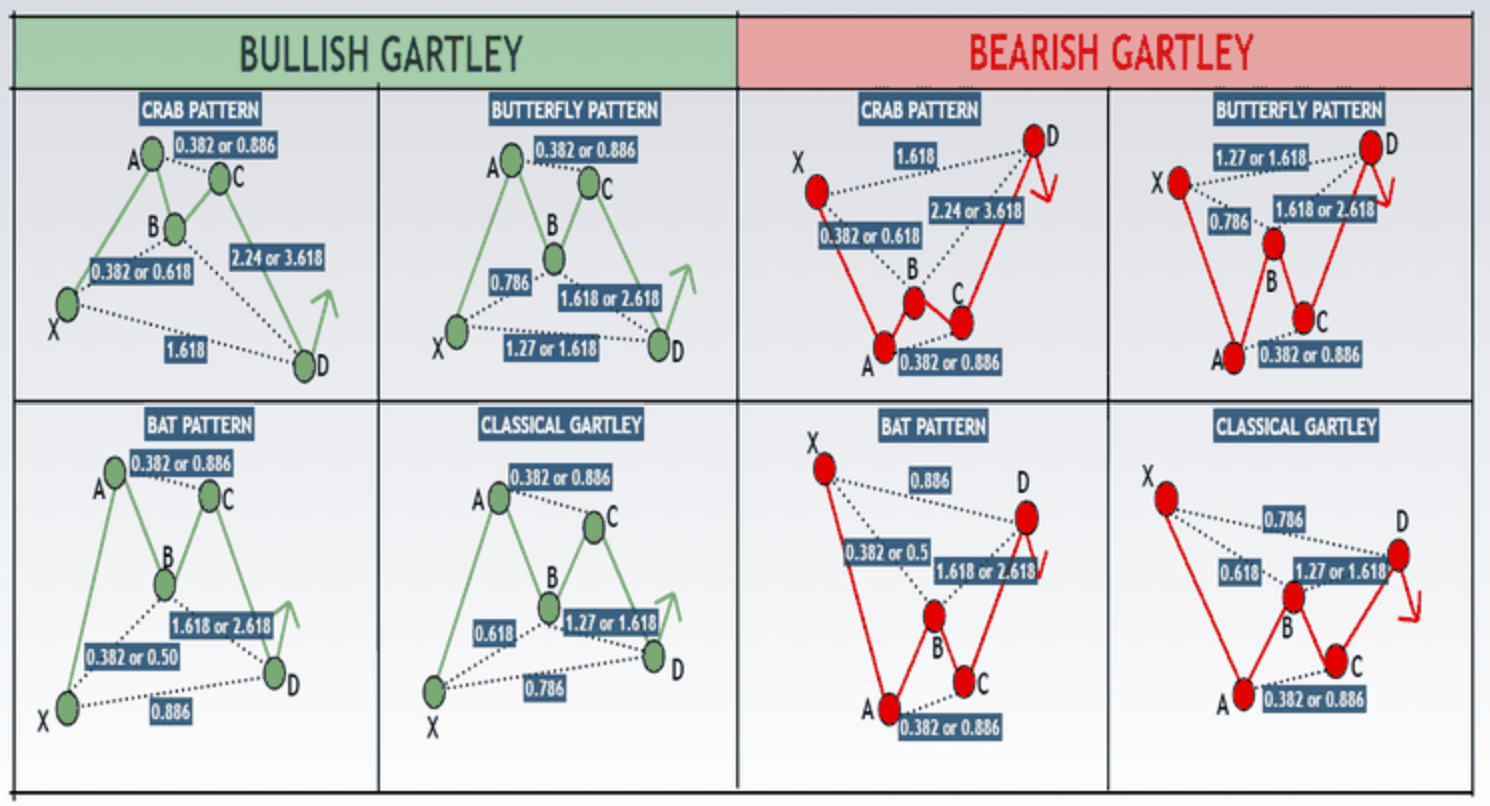
Some common Gartley pattern variations include bullish and bearish patterns, which predict upward and downward price movements respectively.
Traders can apply Gartley patterns in forex trading by using Fibonacci retracement levels to identify potential reversal zones and Fibonacci extensions to set profit targets.
By combining Gartley patterns with other technical analysis tools and indicators, traders can gain a better understanding of market dynamics and make more informed trading decisions.
Trading Strategies Using Gartley Pattern
Traders can employ various strategies when utilizing the Gartley pattern to enhance their trading decisions. One common strategy is to use Fibonacci ratios in trading. Fibonacci ratios are derived from the Fibonacci sequence and are believed to provide important levels of support and resistance in the market. Traders can use these ratios to determine potential entry and exit points for their trades.
Additionally, traders can combine the Gartley pattern with other chart patterns and indicators to confirm their trading signals. This can help reduce the risk of false signals and increase the probability of successful trades. By incorporating these strategies, traders can make more informed decisions when trading the Gartley pattern and potentially improve their overall trading performance.
| Strategies | Description | Benefits | Limitations |
|---|---|---|---|
| Fibonacci retracement | Use Fibonacci ratios to identify potential support and resistance levels | Helps determine entry and exit points | Relies on accurate identification of swing highs and lows |
| Confirmation with other indicators | Combine the Gartley pattern with other technical indicators to confirm trading signals | Reduces the risk of false signals | Requires knowledge and understanding of multiple indicators |
| Risk management | Set stop-loss levels at point 0 or X to limit potential losses | Helps protect capital | Requires careful calculation of risk-reward ratio |
| Profit targets with Fibonacci extensions | Use Fibonacci extensions to determine potential profit targets | Provides a clear objective for taking profits | Relies on accurate identification of swing highs and lows |
Frequently Asked Questions
What are the common Fibonacci ratios used in Gartley patterns?
Fibonacci ratios commonly used in Gartley patterns include 0.382, 0.618, and 0.786. These ratios are applied to the retracement levels between specific points in the pattern, aiding in the identification of potential entry and exit points.
Can Gartley patterns be used in any market or asset class?
Gartley patterns, a type of harmonic chart pattern based on Fibonacci numbers and ratios, can be used in any market or asset class. They can be compared to other harmonic chart patterns and utilized as part of a larger trading strategy.
Are there any specific indicators or tools that can be used to confirm a Gartley pattern?
Volume analysis and trendlines play a crucial role in confirming a Gartley pattern. Volume analysis helps determine the strength of price movements, while trendlines validate the pattern’s structure and provide additional confirmation of potential buy or sell signals.
How can traders determine the potential profit target for a Gartley pattern trade?
Traders can determine the potential profit target for a Gartley pattern trade by using techniques such as Fibonacci extensions and target projections based on the pattern’s structure. These methods help manage risk and identify potential reversal zones in Gartley patterns.
Are there any variations or modifications to the Gartley pattern that traders should be aware of?
Traders should be aware of variations in Gartley patterns, such as the Crab and Butterfly patterns. These variations have different Fibonacci ratios and structure, requiring different trading strategies for optimal results.

