Imagine you’re in the midst of a bustling stock market, surrounded by flashing screens and rapidly changing numbers. You’re trying to decipher the patterns and trends, looking for that golden ticket to financial success. If you’ve ever found yourself in this scenario, then understanding the concept of ‘Golden Crossover’ in trading could be your game-changer.
This trading strategy uses moving averages to predict potential bullish markets, giving traders an edge over their competition. In simple terms, it’s like having a crystal ball that hints at which way the market winds might blow next. But as with any strategy, it has its nuances and limitations too.
So stick around as we delve into the world of Golden Crossover – explaining what it is, how it works, its pros and cons, comparing it with other strategies like Death Cross and sharing tips for successful implementation.
Key Takeaways
- The Golden Crossover is a trading strategy that uses moving averages to predict bullish markets.
- It occurs when a short-term moving average crosses above a long-term moving average.
- Traders use it as an entry point for buying stocks, futures, or forex pairs.
- The Golden Crossover suggests that an upward trend may be coming and is considered a bullish indication for traders.
What is Golden Crossover in Trading?
Ever wondered what’s the secret behind successful trading? It’s all about understanding key technical indicators, like the Golden Crossover!
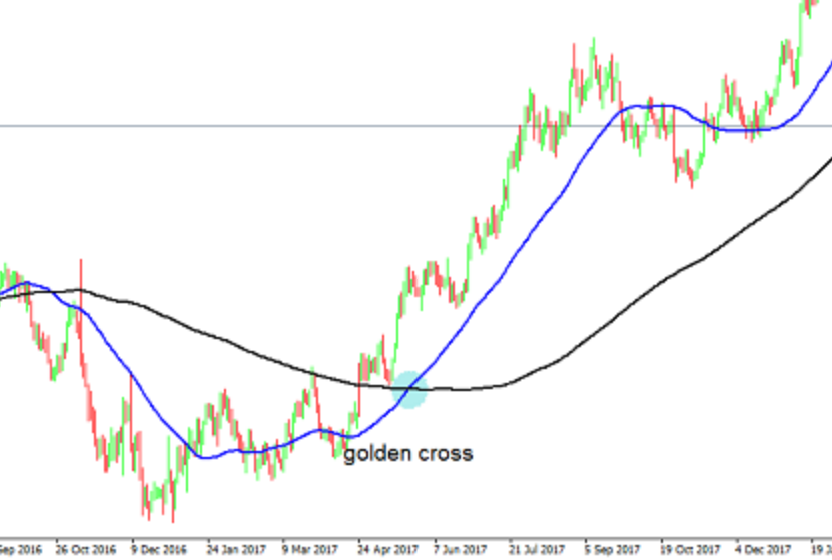
So, what is a golden crossover in trading? Simply put, it’s a bullish signal that occurs when a short-term moving average crosses above a long-term moving average. This golden cross pattern represents a significant shift in market sentiment as it indicates that the momentum has changed from bearish to bullish.
Traders often use this as an entry point for buying stocks, futures, or forex pairs because they believe prices will continue to rise. Understanding what is golden crossover can be crucial for your success in trading.
Keep in mind though, no indicator provides guaranteed results – always combine them with other analysis techniques and sound risk management strategies!

Understanding Moving Averages
You’ve probably heard about moving averages in the stock market, but do you really know what they mean?
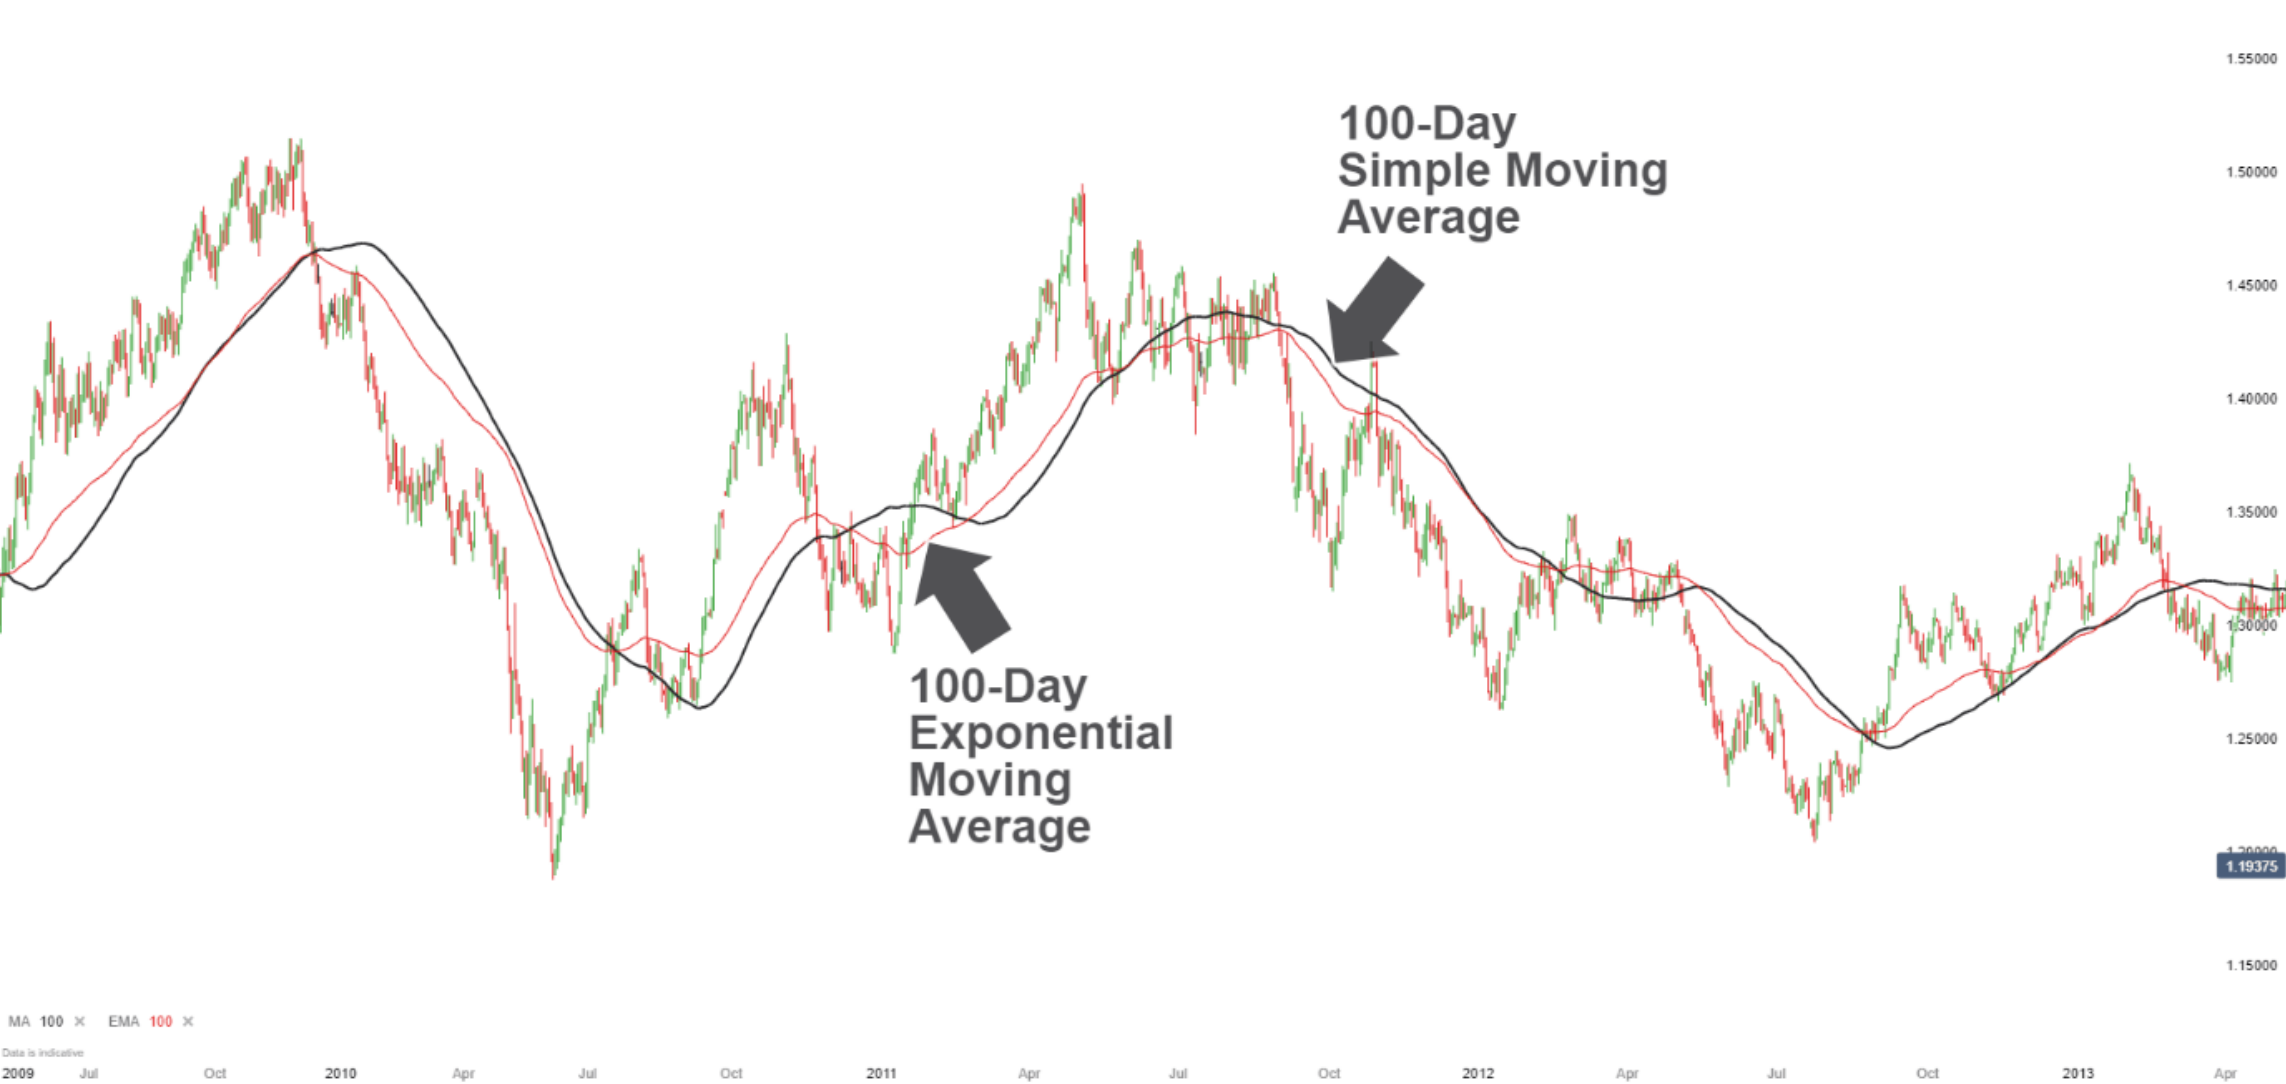
For instance, let’s take the Simple Moving Average (SMA); it’s calculated by adding recent closing prices and then dividing that by the number of time periods in the calculation average. This gives traders a clearer view of price trends without daily volatility skewing their perception.
Now consider the Exponential Moving Average (EMA), which focuses more on recent data points and reacts faster to price changes – imagine if you’d used this during last month’s tech stock fluctuation, your decision-making could’ve been significantly different!
SMA:
- Gives a steady analysis
- Less affected by short-term fluctuations
EMA:
- Reacts quickly to market changes
- Greater emphasis on most recent data points

Explaining Golden Crossover
In the thrilling world of investing, there’s a powerful tool that can signal a potentially lucrative bull market on the horizon – it’s called the Golden Crossover.
This pattern occurs when a short-term moving average, like the 50-day one, crosses above its long-term counterpart such as the 200-day line. This crossing signifies a change in momentum and suggests that an upward trend may be coming your way.
You see, when these averages cross paths and the shorter term surpasses the longer term, it’s seen as a bullish indication for traders. It means your assets could shine brighter than ever before!
So keep an eye out for this golden opportunity to improve your trading strategies because recognizing such patterns is instrumental in identifying potential buying opportunities or even deciding when to sell existing positions.
Golden Crossover Strategy
So, you’re telling me there’s a strategy that harnesses the power of this celestial financial phenomenon? Well, don’t just sit there – spill the beans! The Golden Crossover Strategy is an effective tool in trading. It involves determining optimal timeframes for moving averages, setting entry and exit points, managing risk, and applying stop-loss orders.
| Task | Description | Importance |
|---|---|---|
| Determine Moving Averages Timeframes | Choose short-term (e.g., 50-day) and long-term (e.g., 200-day) averages. | Crucial to identify market trends. |
| Set Entry/Exit Points | Identify when the short-term average crosses above or below the long-term one. | Key in maximizing profit and minimizing loss. |
| Manage Risk | Don’t invest more than you can afford to lose; diversify your portfolio. | Essential for sustainable trading. |
| Apply Stop-Loss Orders | Set a price level that will trigger an automatic sell if reached. | Protects from severe losses during drastic market downturns. |
Mastering this strategy requires practice but it’s definitely worth your effort!
Examples and Case Studies about Golden Crossover
Ready to see this strategy in action? Let’s dive into some real-life examples and case studies that showcase its effectiveness.
One notable instance is Apple Inc. in 2009, where a golden crossover occurred, leading to a significant uptrend for years.
Similarly, the S&P 500 chart from 2012 shows a golden crossover triggering a bull market that lasted until 2015.
However, it’s not always rosy; the Dow Jones Industrial Average in late 2007 saw a golden crossover just before the Great Recession kicked off.
Remember, while these examples provide evidence of potential gains from this strategy, it’s no guarantee of success. Market conditions can change rapidly and other factors could influence outcomes as well.
Always conduct thorough analysis before making trading decisions.
Advantages and Limitations of Golden Crossover
Let’s delve into the pros and cons of this strategy, shall we? It’s essential to understand what you’re signing up for before jumping in.
The Golden Crossover has several advantages:
- It’s a straightforward technical analysis tool, providing clear buy and sell signals.
- It provides an objective measure of a trend reversal, making it less likely to be influenced by emotional biases.
- It reduces risk by indicating long-term upward trends.
However, it does have limitations:
- False signals can occur during volatile markets, leading to potential losses.
- It’s a lagging indicator, meaning that the signal occurs after the price change has already started.
To mitigate these risks, combine the Golden Crossover with other indicators. This approach will give you a more robust trading strategy.
Golden Crossover vs. Death Cross
Now, imagine you’re looking at a chart and notice the fast-moving average plummeting below the slow-moving one; this ominous event is known as the Death Cross. It’s the complete opposite of a Golden Crossover, which occurs when the fast average rises above the slow one. Both these strategies have their own strengths and weaknesses depending on market conditions.
| Golden Crossover | Death Cross |
|---|---|
| Bullish signal | Bearish signal |
| Best in uptrend markets | Ideal for downtrend markets |
| Risks false positives | May result in false negatives |
While a Golden Crossover may hint towards potential gains, it can also risk false positives especially in volatile markets. Similarly, a Death Cross might indicate possible losses but might yield false negatives when market trends suddenly reverse. Thus, both require careful analysis for effective trading decisions.
Golden Crossover: Tips for Successful Implementation
To effectively implement this bullish strategy, it’s crucial to keep some key tips in mind.
Firstly, ensure you’re using the Golden Crossover method with a comprehensive understanding of its mechanics. It involves closely observing the intersection of a short-term moving average (like 50-day) and a long-term moving average (such as 200-day).
Secondly, remember that backtesting is vital – it helps in optimizing the parameters for better results.
Moreover, don’t rely solely on this strategy; incorporate other technical indicators for more accurate predictions.
Lastly, keep track of your trading activities regularly – market conditions change rapidly and so should your strategies. Remember, successful implementation is not just about applying a technique but adapting to market dynamics intelligently.
Frequently Asked Questions
How does the Golden Crossover compare to other trading indicators?
In the dance of trading indicators, the golden crossover shines. It’s seen as a ballet of bullish momentum, compared to others that may waltz less predictably. You’ll find it gives detailed, analytical insights for potential growth.
How can I incorporate the Golden Crossover into my existing trading strategy?
You can incorporate the golden crossover into your trading strategy by tracking two moving averages. When the short-term average crosses above the long-term one, it’s a buy signal. Conversely, it’s a sell signal when it falls below.
What are some common mistakes traders make when using the Golden Crossover?
Common mistakes include relying solely on the golden crossover for decisions, not considering market volatility, and failing to use other indicators to confirm trends. Not setting stop-loss limits is another error traders often make.
Can Golden Crossover be used in all types of markets, including commodities, forex, and cryptocurrencies?
Like a Swiss army knife, the golden crossover can be quite versatile. Yes, it can be used in all types of markets, including commodities, forex and cryptocurrencies. However, its effectiveness might vary based on market volatility.
Are there specific software or tools that can help identify a Golden Crossover?
Yes, there are specific tools like MetaTrader, TradingView, and Bloomberg Terminal that can help you identify a golden crossover. These platforms provide real-time charting capabilities to spot this important signal in various markets.


