Did you know that the long-legged doji candlestick pattern is one of the most powerful indicators in technical analysis? With its unique shape and positioning, this pattern signifies significant market indecision. In fact, it is estimated that this particular candlestick formation occurs in nearly 5% of all trading sessions.
But what does it really mean for your trading strategy? Well, when you spot a long-legged doji, it’s a strong indication that the market could be on the verge of a trend reversal. This means there might be an opportunity to profit from an upcoming price change.
In this article, we’ll delve into the meaning behind the long-legged doji pattern and how you can incorporate it into your trading strategy. You’ll also learn about confirmation signals that can help you make reliable trading decisions. Plus, we’ll share some valuable tips for successful trading with the long-legged doji.
Get ready to take your trading game to new heights as we unlock the secrets behind this powerful candlestick formation!
Key Takeaways
- Long-legged doji candlestick pattern signifies significant market indecision
- It provides an opportunity to profit from potential trend reversals
- The length of shadows relative to the body indicates the strength or weakness of buyers or sellers
- It is important to use other technical indicators for confirmation and to analyze volume and trend lines for successful trading.
Understanding the Long Legged Doji Pattern
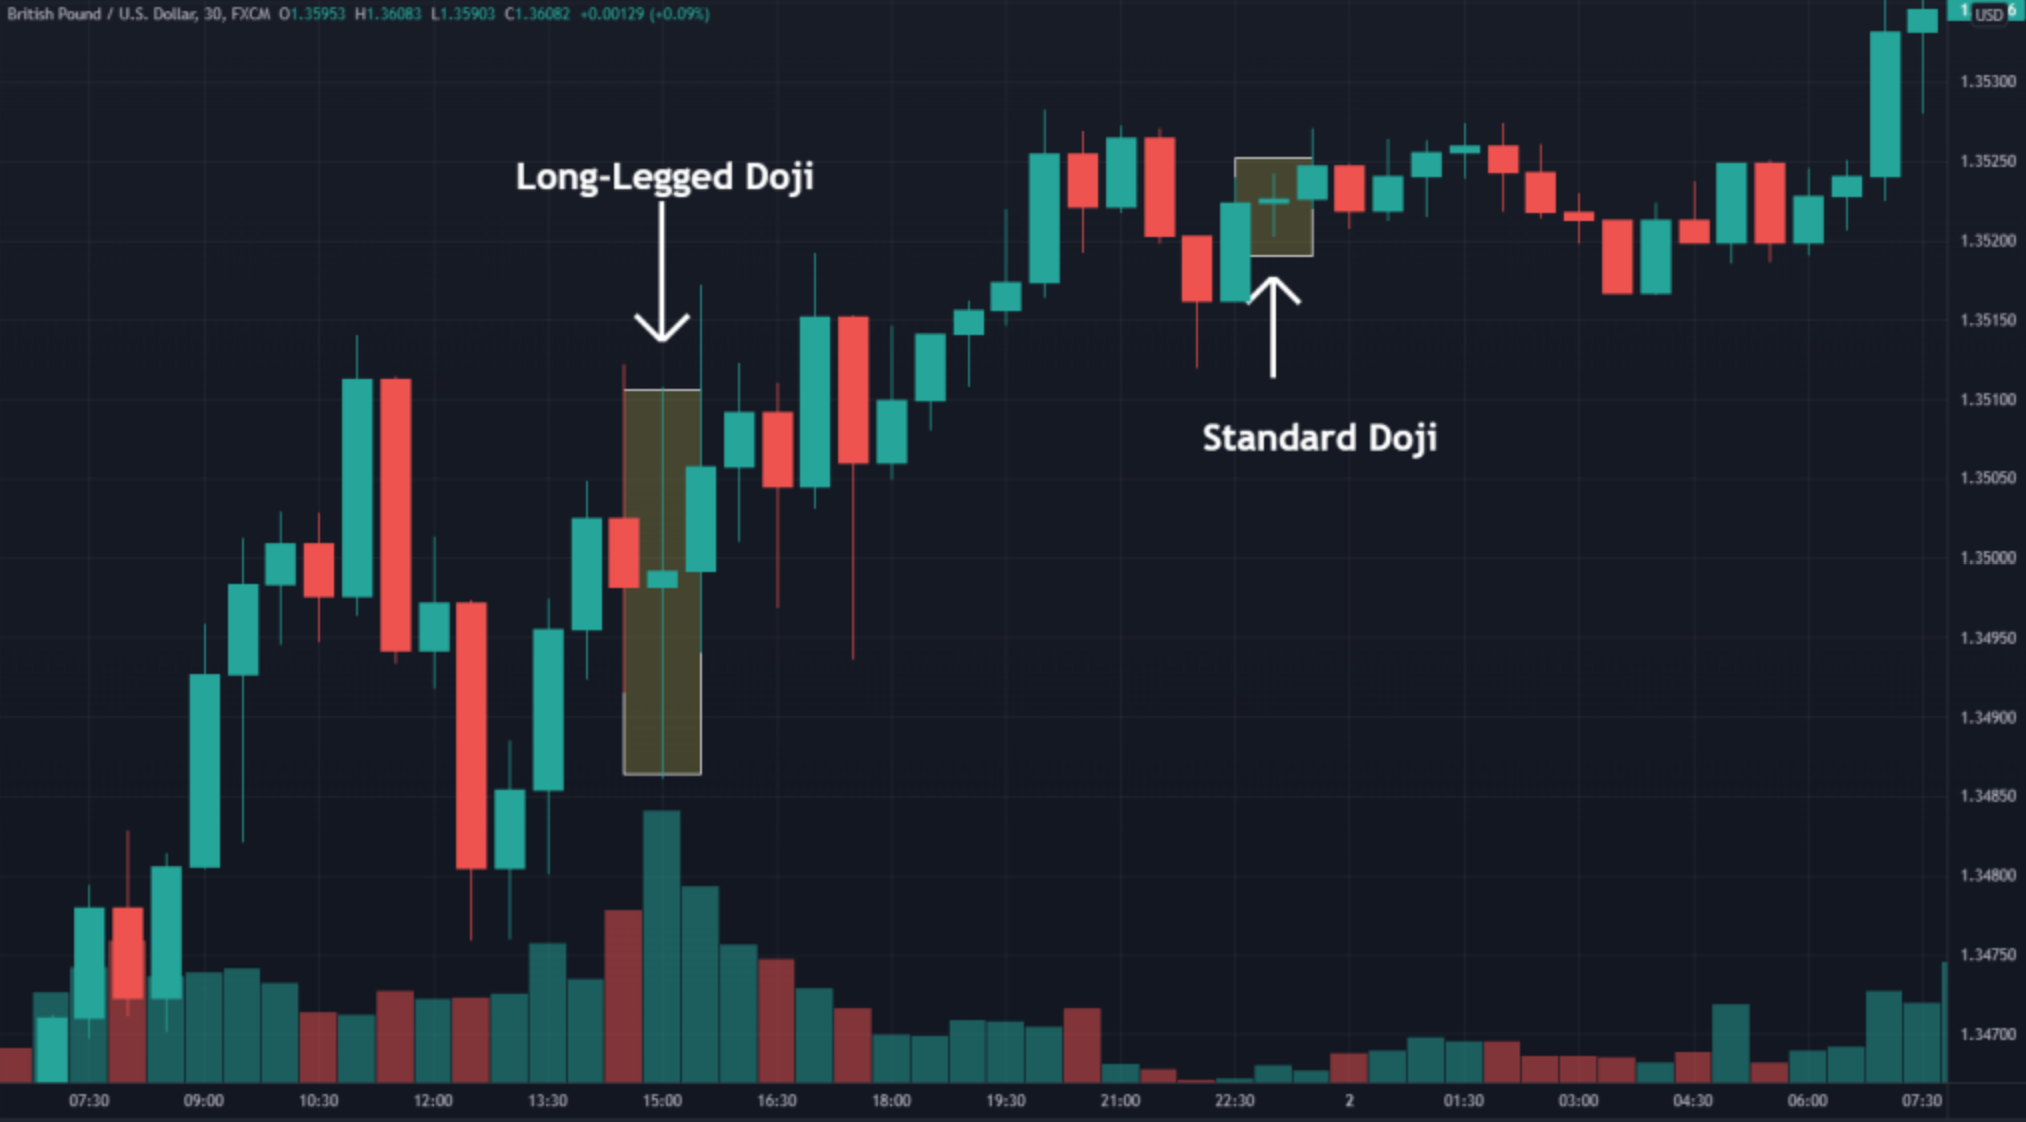
The long legged doji candlestick pattern, with its extended upper and lower shadows, is a powerful signal that indicates indecision in the market and can be a valuable tool for traders. When interpreting candlestick patterns, it’s crucial to analyze market sentiment to understand the potential direction of price movements. The long legged doji is formed when the opening and closing prices are close to each other, creating a small body, but with significant upper and lower shadows.
This pattern suggests that buyers and sellers are evenly matched, leading to uncertainty in the market. Traders can use this information to anticipate potential reversals or trend continuations. By closely observing the length of the shadows relative to the body, traders can gain insight into how strong or weak buyers or sellers are at different price levels. Overall, understanding the long legged doji pattern provides traders with an analytical tool for assessing market dynamics and making informed trading decisions.
Interpreting the Indecision in the Market
Imagine yourself standing in the midst of a chaotic marketplace, where uncertainty hangs heavy in the air and traders frantically ponder their next move. As you observe the candlestick patterns on your screen, one pattern catches your eye—the long legged doji. This candlestick formation signifies indecision in the market, where neither buyers nor sellers have gained control. The long upper and lower shadow of the doji indicates that prices moved significantly higher and lower during the trading session but ultimately closed near the opening price.
Interpreting this pattern requires analyzing other factors such as volume and trend direction. It suggests that market participants are uncertain about the future direction of price movement. Traders often use it as a signal to exercise caution or wait for more confirmation before making their next trade. By understanding and interpreting market uncertainty through candlestick patterns like the long legged doji, traders can make informed decisions and navigate through volatile markets more effectively.
Identifying Potential Trend Reversals
Amidst the chaos of the marketplace, you must be vigilant in spotting potential trend reversals that could shake the very foundations of your trades. One powerful tool for identifying these reversals is candlestick analysis, specifically looking for reversal patterns.
One such pattern is the long-legged doji candlestick. This pattern is characterized by a small body and long upper and lower shadows, indicating indecision in the market. When this pattern forms after a prolonged uptrend or downtrend, it suggests that the trend may be losing steam and a reversal could be imminent.
To help you better understand how to identify potential trend reversals using the long-legged doji candlestick, refer to the table below:
| Candlestick Pattern | Interpretation |
|---|---|
| Long-Legged Doji | Indecision |
| Uptrend | Bullish |
| Downtrend | Bearish |
By analyzing these patterns and considering other technical indicators such as support and resistance levels, moving averages, and volume, you can increase your chances of successfully predicting trend reversals and making informed trading decisions.
Incorporating the Long Legged Doji into Your Trading Strategy
To effectively incorporate the long-legged doji into your trading approach, picture yourself carefully analyzing market indicators and considering the potential impact of this pattern on your trades. Here are three key aspects to consider:
- Risk management in trading with the long-legged doji: The long-legged doji can indicate a potential trend reversal, but it is essential to have proper risk management strategies in place. Set stop-loss orders to limit potential losses if the trade does not go as expected.
- Trading psychology and the long-legged doji pattern: The appearance of a long-legged doji can evoke mixed emotions, such as uncertainty or indecision in the market. It is crucial to remain calm and objective when incorporating this pattern into your strategy. Avoid making impulsive decisions based solely on its presence.
- Consider other technical indicators: While the long-legged doji can provide valuable information about potential trend reversals, it is best used in conjunction with other technical indicators. Look for confirmation from tools like moving averages, volume analysis, or momentum oscillators before making trading decisions.
By understanding these factors and incorporating them into your trading strategy, you can make more informed decisions when encountering a long-legged doji pattern. Remember to always practice sound risk management and maintain a disciplined mindset while trading.
Using Confirmation Signals for Reliable Trading Decisions
When using confirmation signals, you can rely on them like a compass guiding you through the uncertain waters of trading. These signals provide additional information that helps confirm or validate your trading decisions based on the long legged doji candlestick pattern. By using confirmation signals, you can increase the reliability of your trades and reduce the risk of false signals or market noise.
Common confirmation signals include trend lines, moving averages, and other technical indicators such as stochastic oscillators or relative strength index (RSI). These indicators help confirm the presence of buying or selling pressure in conjunction with the long legged doji pattern, giving you more confidence in your trading decisions. Remember to always consider multiple confirmation signals before making any trade to ensure reliable and informed decision-making.
Tips for Successful Trading with the Long Legged Doji
Maximize your trading success by incorporating these valuable tips for navigating the uncertain waters of the market with the long-legged doji. These tips will help you make informed decisions and increase your chances of profitable trades.
- Analyze volume: Pay attention to the volume accompanying the long-legged doji candlestick. Higher-than-average volume can confirm a significant price reversal, while low volume may indicate indecision.
- Observe trend lines: Look for trend lines that intersect with the long-legged doji, as they can act as support or resistance levels. A break above or below these trend lines can signal a potential trend reversal.
- Combine with other indicators: Enhance your analysis by using other technical indicators like moving averages, oscillators, or Fibonacci retracements in conjunction with the long-legged doji pattern. This can provide additional confirmation and improve your trading strategy.
By following these tips and incorporating other relevant indicators into your analysis, you can harness the power of the long-legged doji candlestick pattern to make more successful trades in an unpredictable market environment.
Frequently Asked Questions
Can the long-legged doji candlestick pattern be used in any time frame?
Using the long-legged doji pattern in different time frames has advantages and disadvantages. It can provide valuable insights for shorter time frames, but may be less reliable in longer time frames. Comparatively, it is unique among candlestick patterns and offers distinct trading analysis opportunities.
How often does the long-legged doji pattern occur in the market?
The long-legged doji pattern occurs frequently in the market, making it a significant signal for traders. Its frequency suggests that it can provide valuable insights into potential market reversals or indecision.
Are there any additional technical indicators that can be used to confirm the long-legged doji pattern?
To confirm the long-legged doji pattern, you can use other technical indicators like volume analysis, trendlines, and oscillators. These indicators provide additional insights and help validate the signals given by the long-legged doji pattern. Incorporating these indicators into your trading strategy can enhance the accuracy of your trades.
Can the long-legged doji pattern accurately predict the duration of a trend reversal?
To assess the accuracy of duration prediction for trend reversals, one can analyze the long-legged doji pattern. By studying its characteristics and comparing it to historical data, you can gain insights into how reliable this pattern is in forecasting trend reversal durations.
Are there any specific risk management techniques that should be used when trading with the long-legged doji pattern?
To effectively manage risks while trading with the long-legged doji pattern, implement specific risk management techniques. Use stop-loss orders to limit potential losses and consider position sizing based on your risk tolerance. These strategies can enhance your trading performance.

